Chapter 6 EFM Configuration
Prerequisites
Ensure you have completed all the steps in the following documents before continuing:
- Chapter 1 IR829 Roadway Broker Installation
- Chapter 2 Regional Broker Installation
- Chapter 4 RWIS and Car Simulator
- Chapter 5 Serial DMS
Allow the IR829 Roadway Broker to Connect Upstream
- Open the regional broker EFM System Administrator web interface here and log in as the
efmAdminuser with the password that was set during installation
The “radiation”-style warning in the upper right-hand of the page indicates that there are downstream brokers in quarantine.
- Navigate to
Permissions > Quarantine > Authorize - Select the IR829 roadway broker from the list and click the
Authorizebutton at the bottom
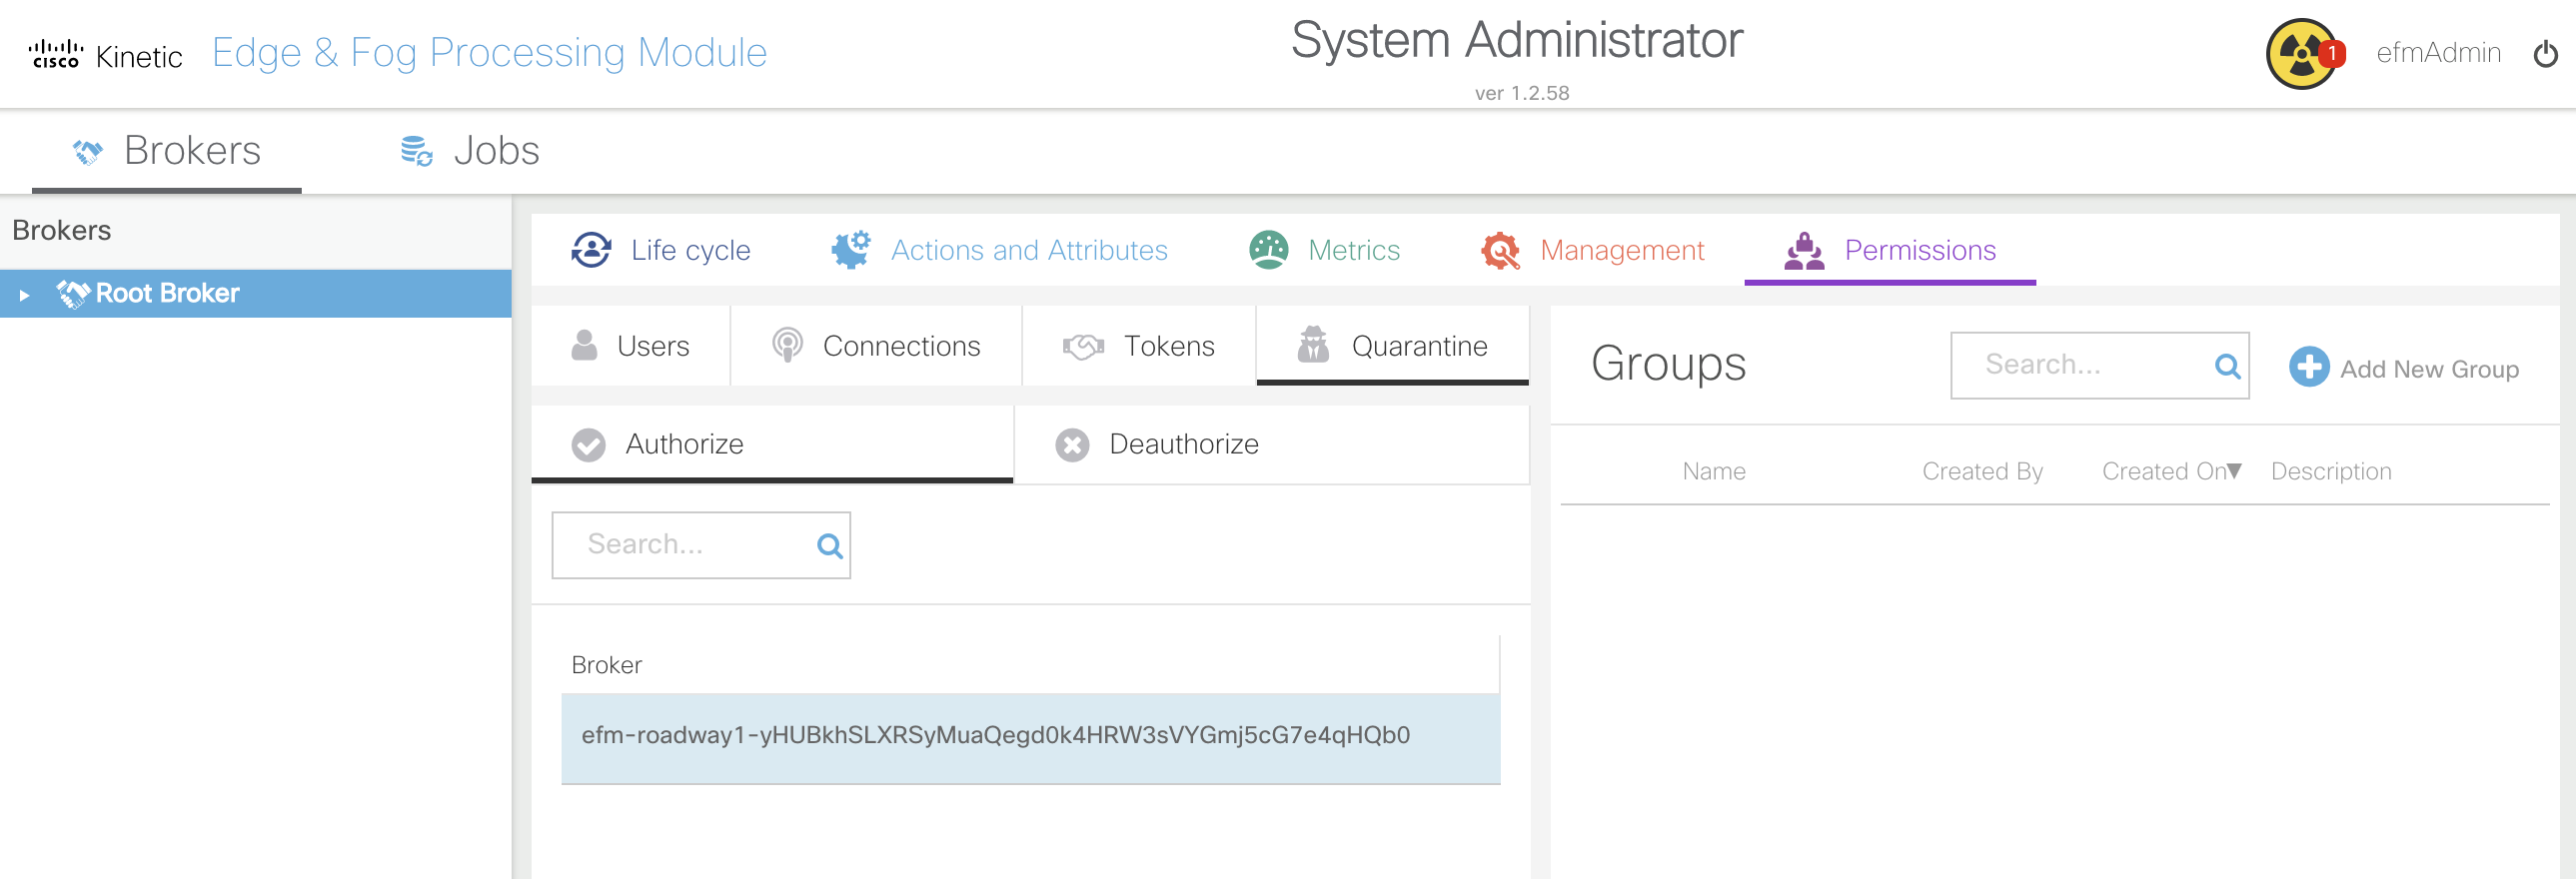
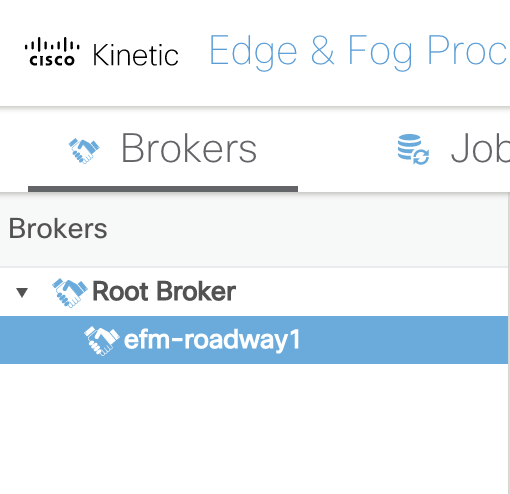
You should now see the IR829 roadway broker
efm-roadway1listed underneath theRoot Brokerin theBrokerssection on the left-hand of the page.
- Select
efm-roadway1from theBrokerssection
Add DSLinks to the Roadway Broker
MQTT DSLink
- Navigate to
Management > links > Install Link - Select
MQTTfrom thelinkdropdown - Enter
mqttas the name and clickInvoke
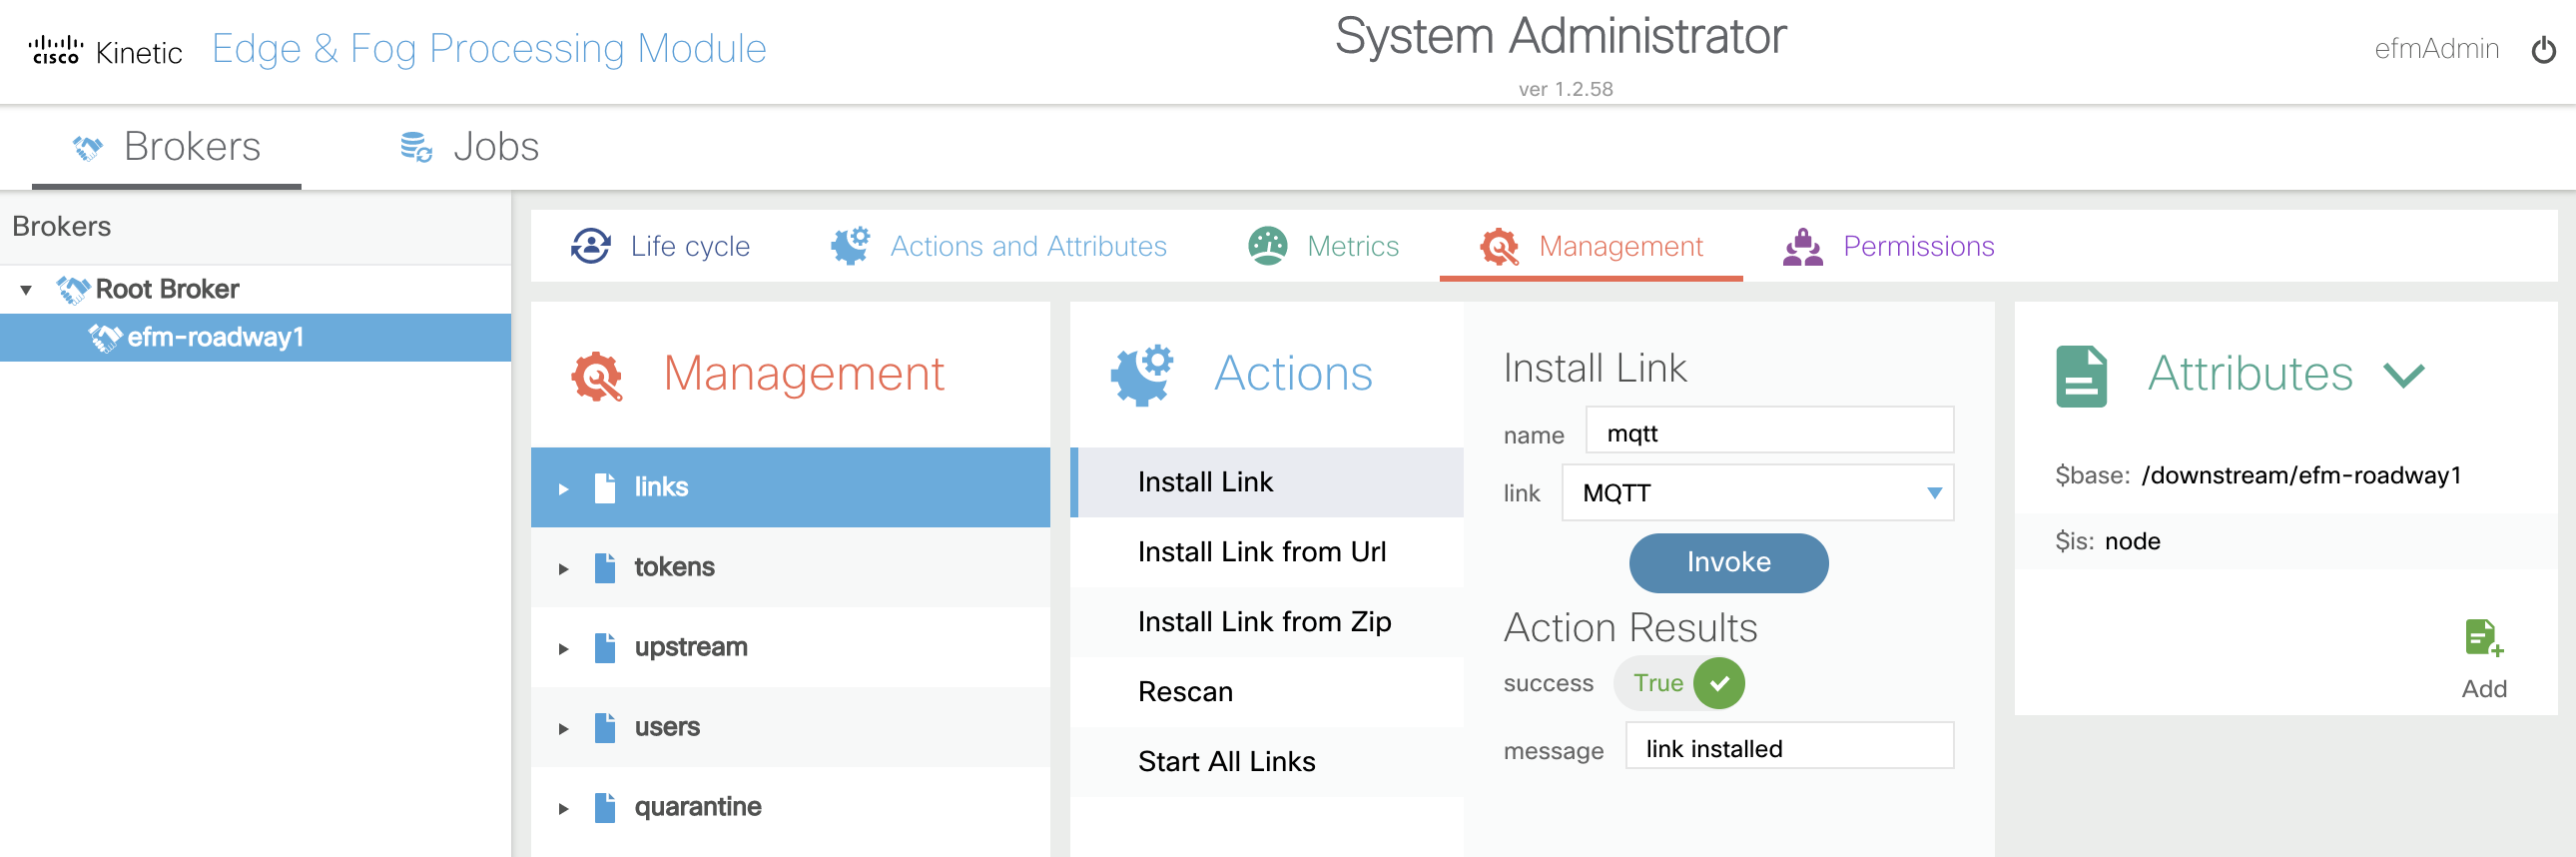
It should say success True if the operation was successful.
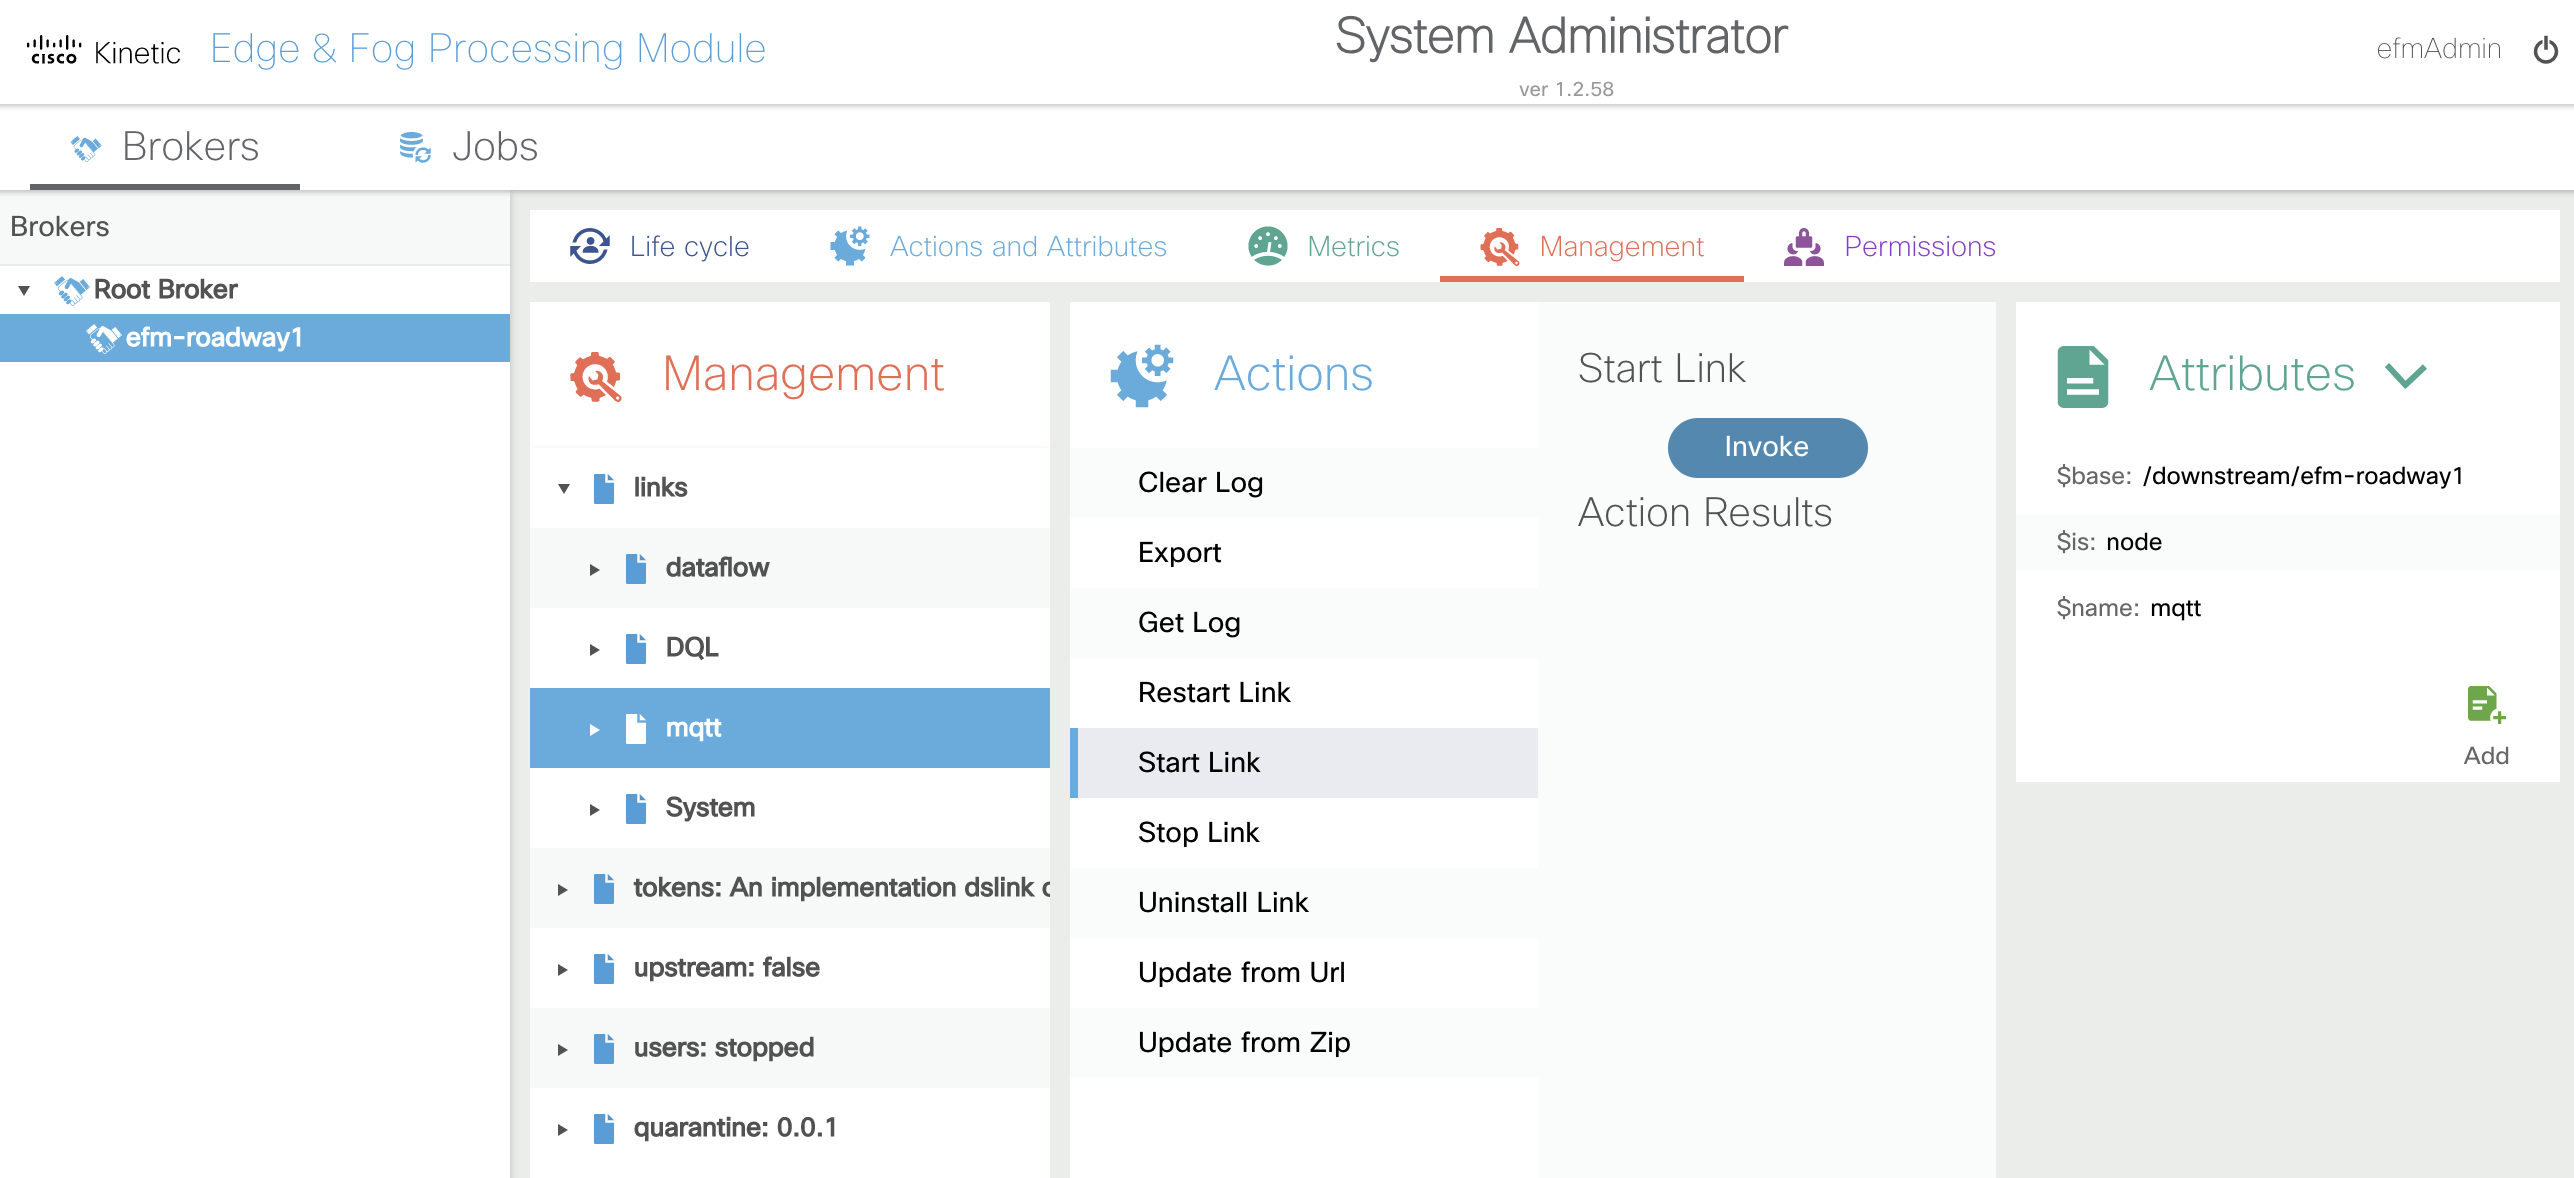
- Navigate to
Management > links > mqtt > Start Link - Click
Invoke
C-Based Serial DSLink
- Navigate to
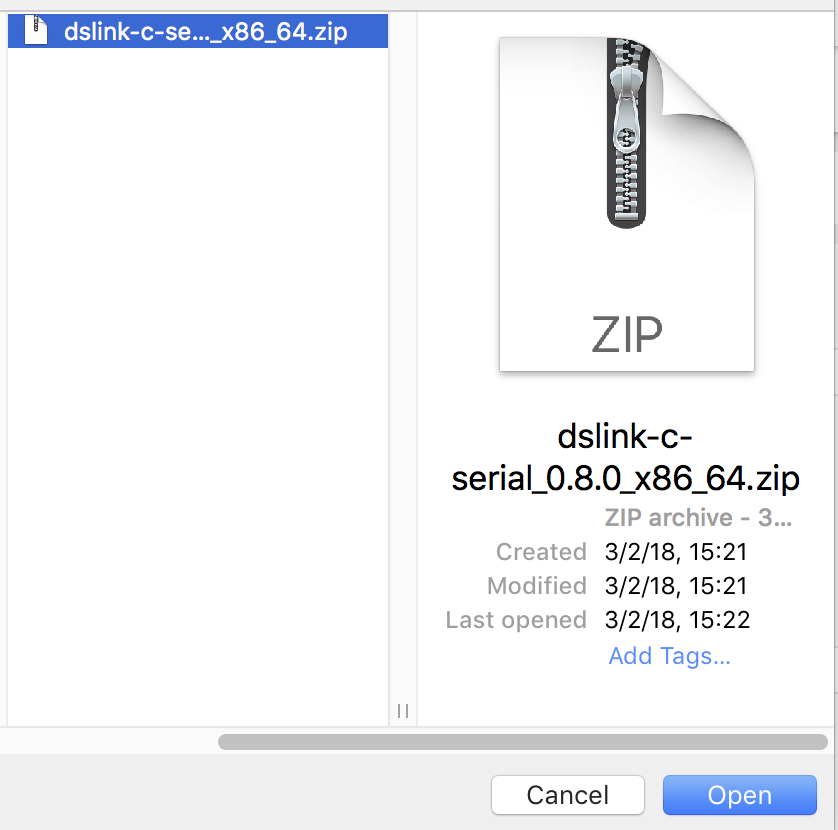
Management > links > Install Link from Zip - Click
Choose Fileand select thedslink-c-serial_0.8.0_x86_64.zipDSLink file
- Enter
serialas the name and clickInvoke
It should say success True if the operation was successful.
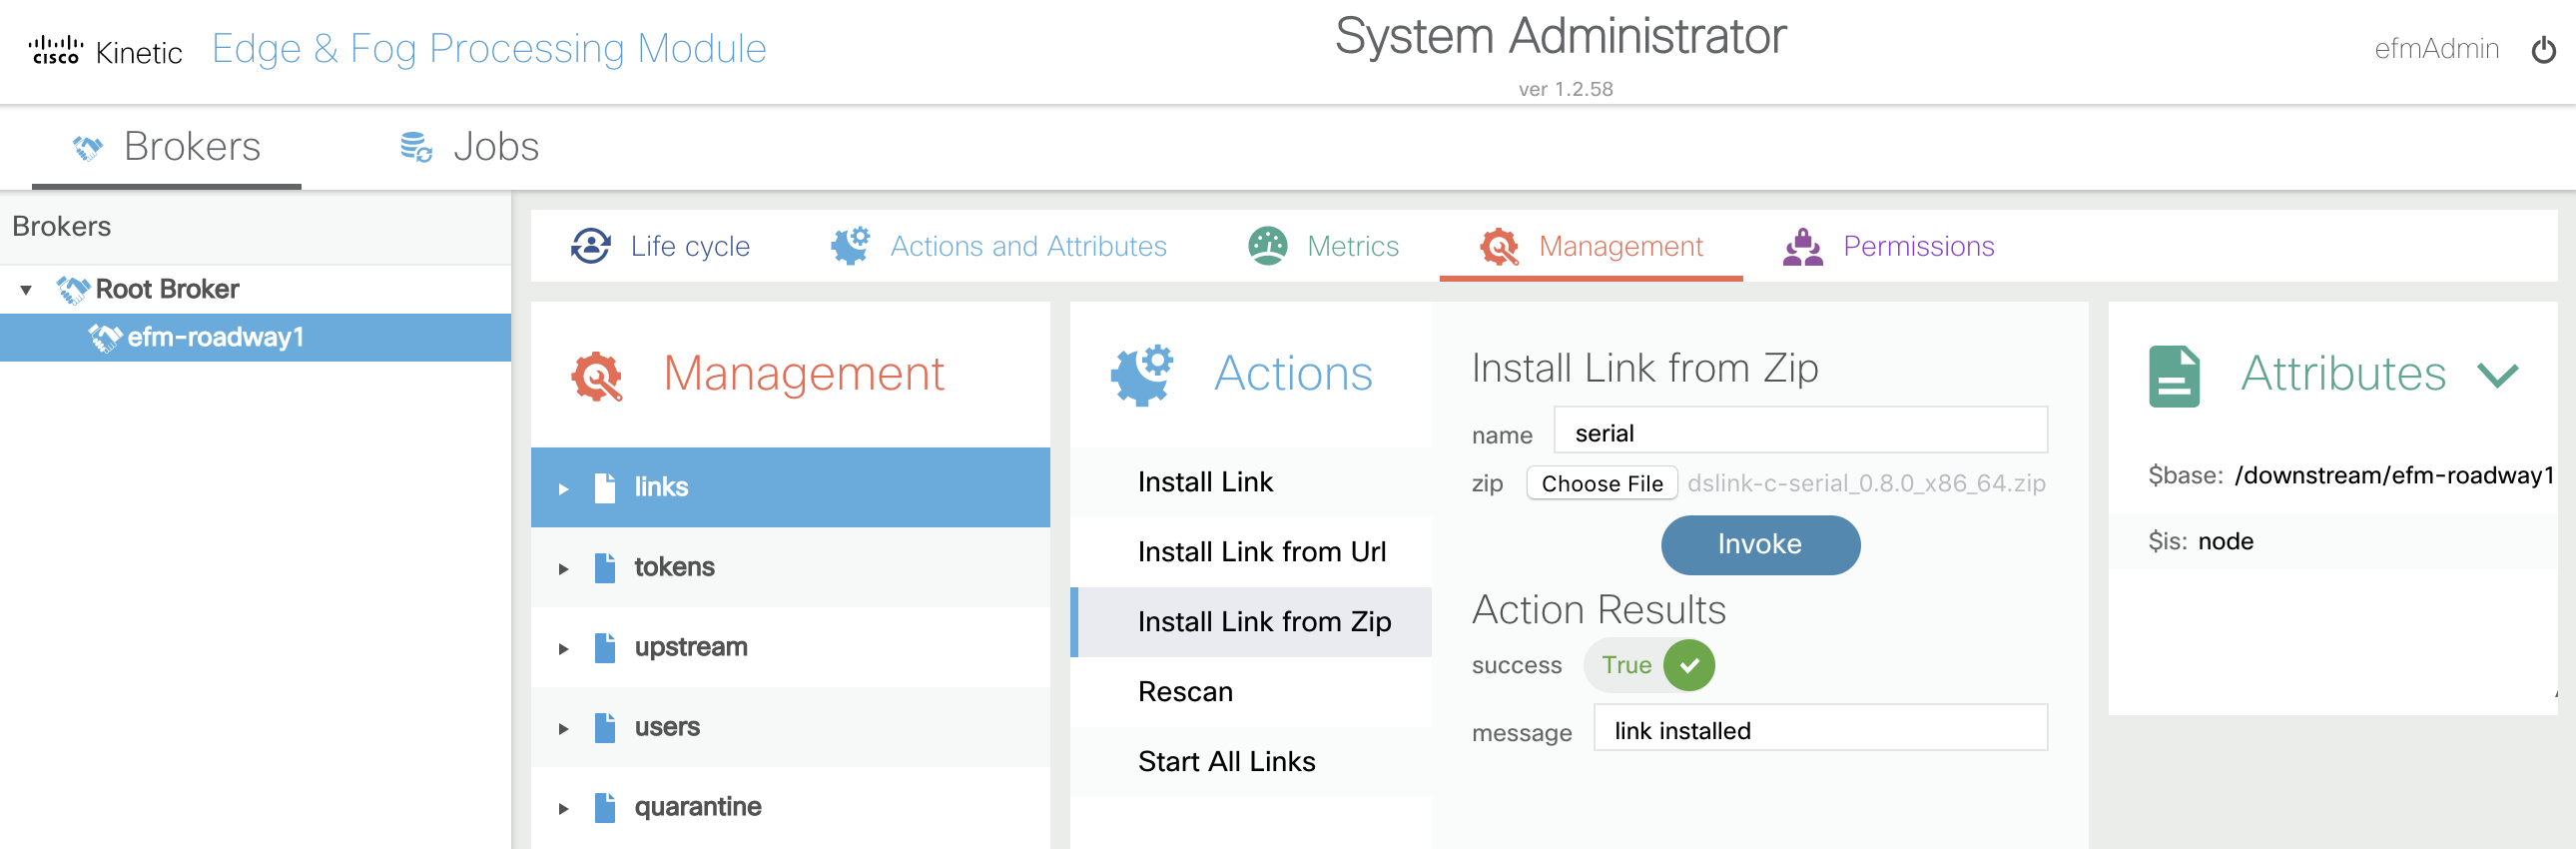
- Navigate to
Management > links > serial > Start Link - Click
Invoke
Configure Roadway Broker DSLinks
MQTT
- Open the regional broker EFM Dataflow Editor web interface here and log in again as the
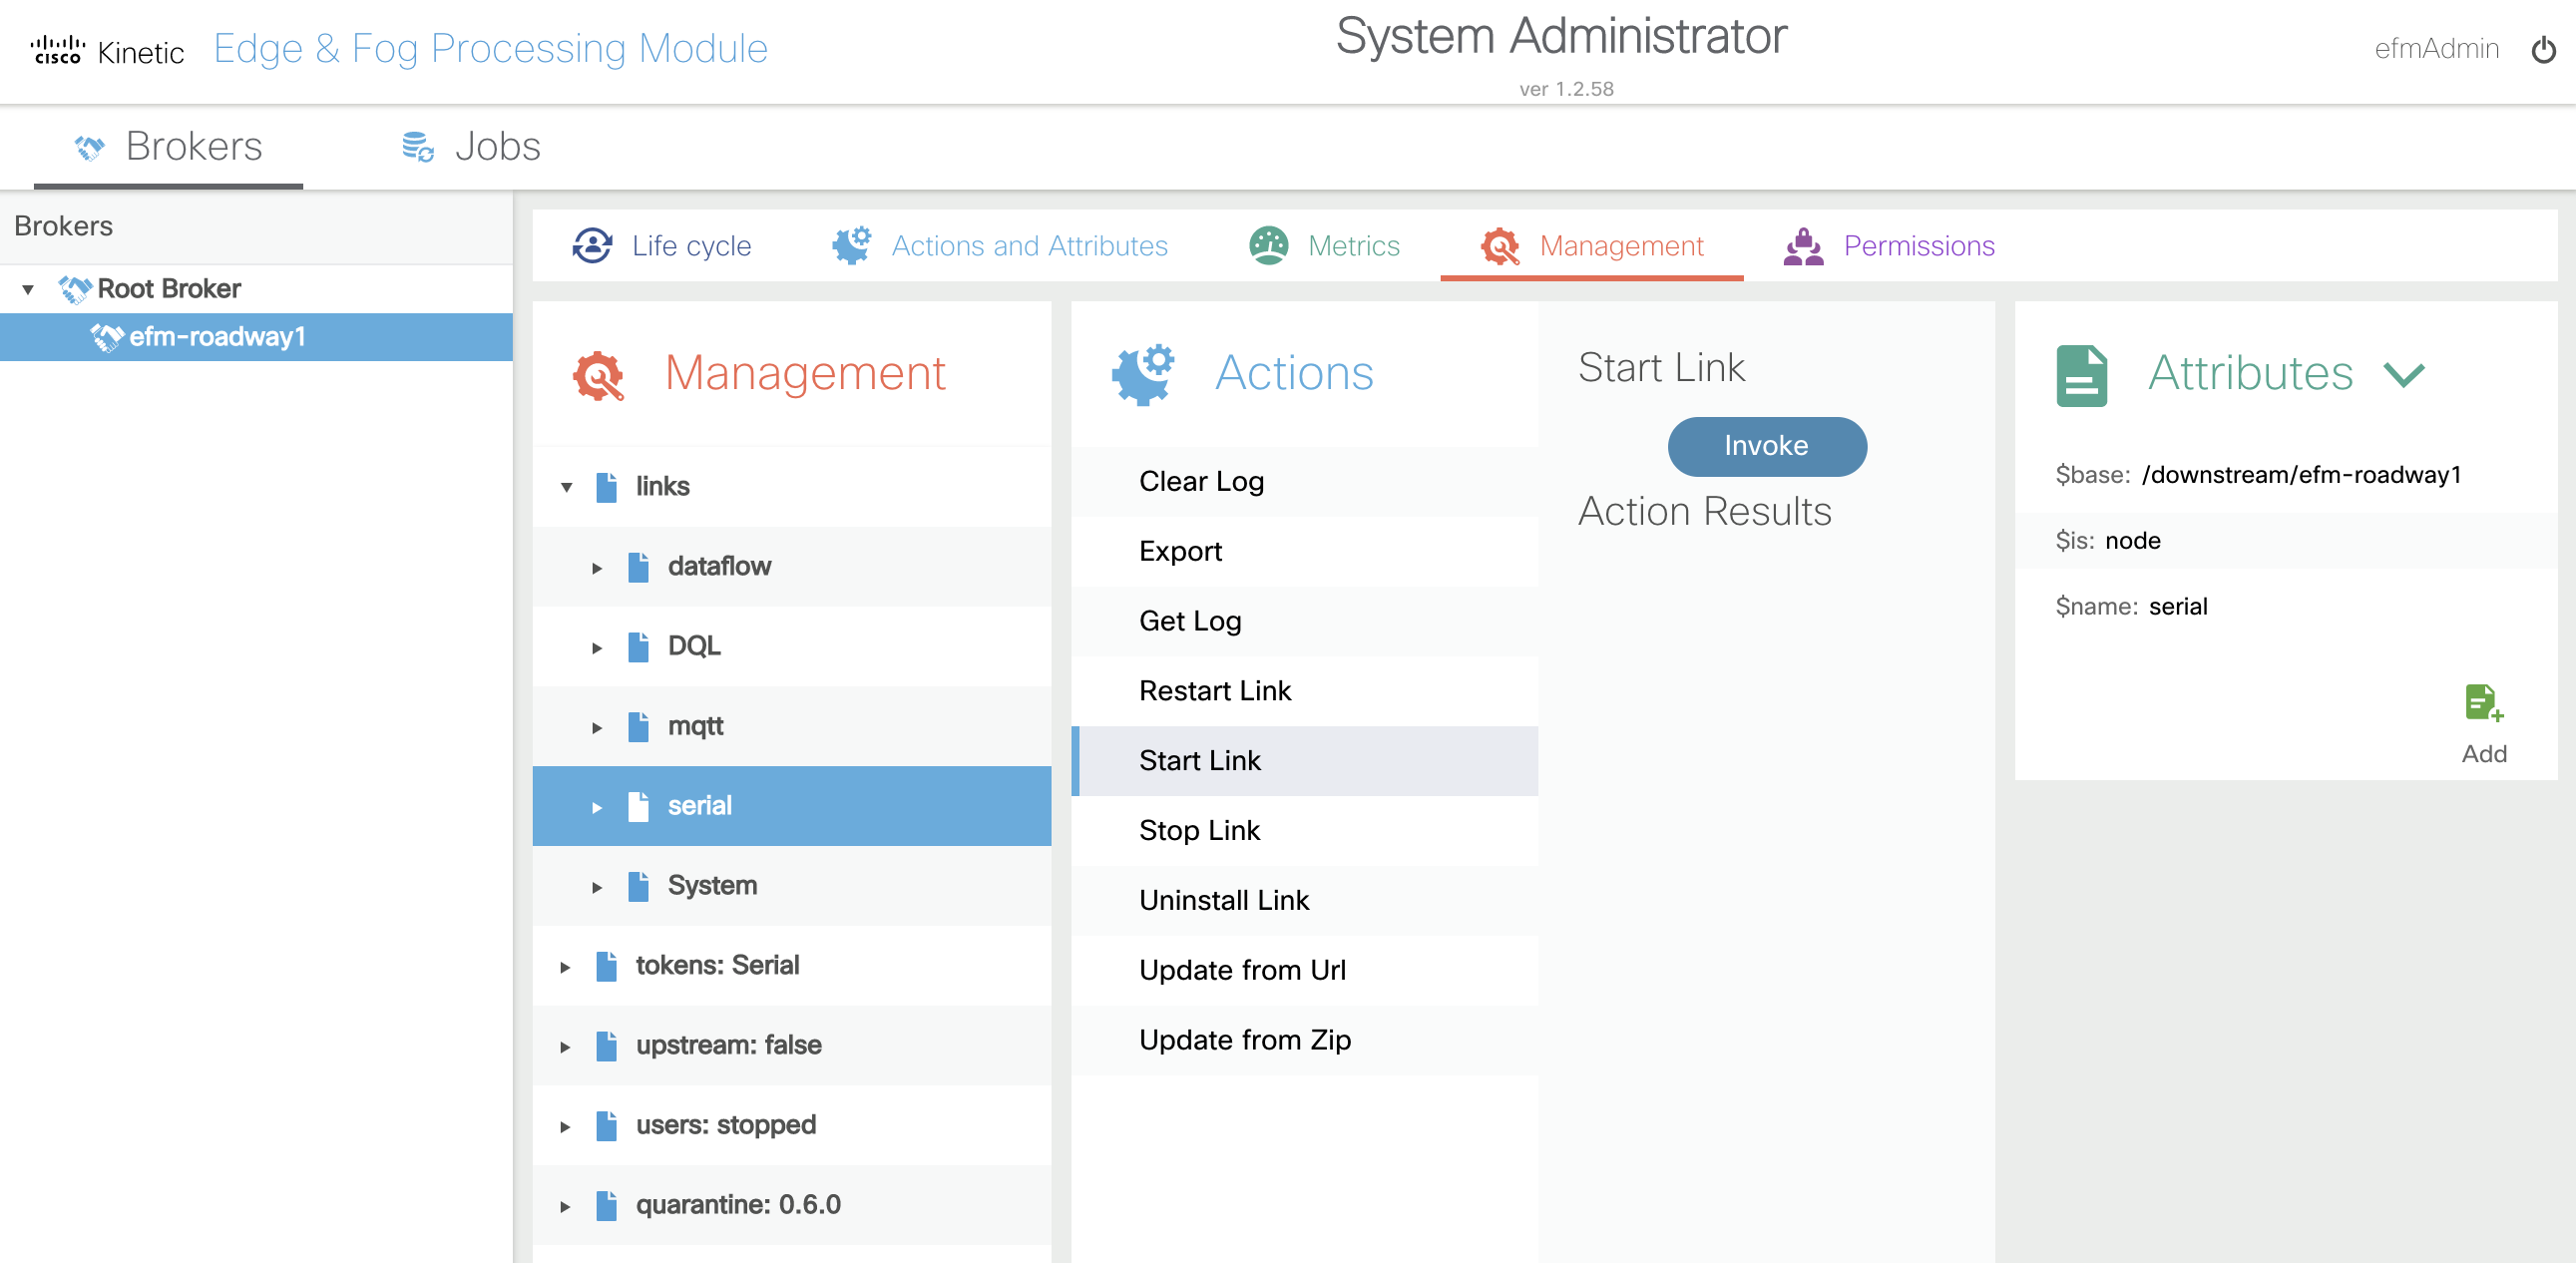
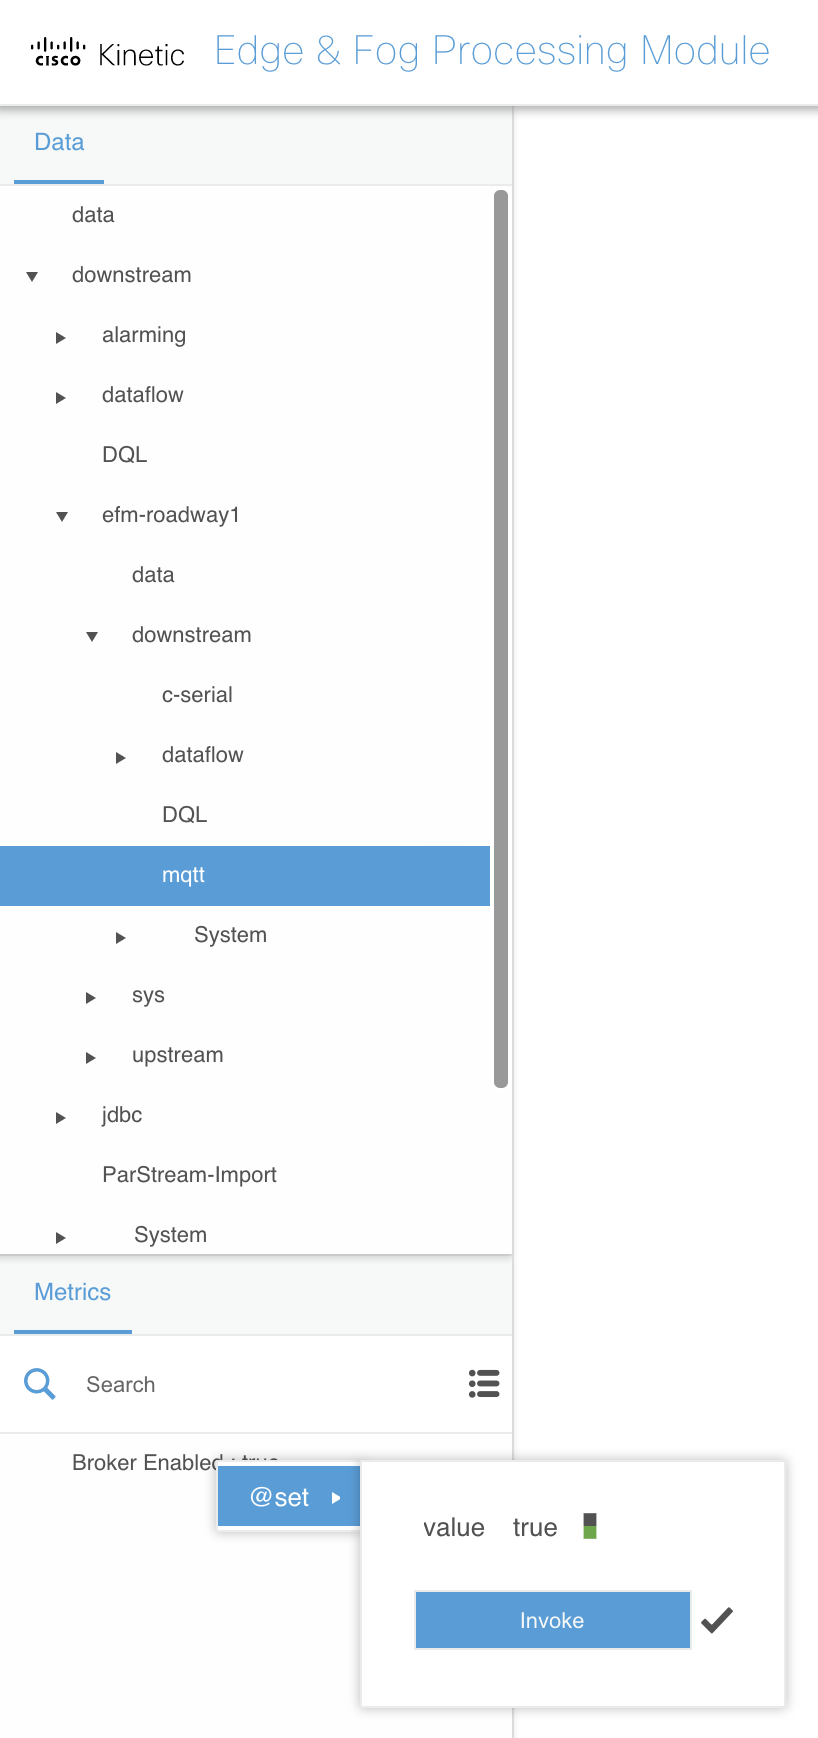
efmAdminuser, if prompted - Navigate to
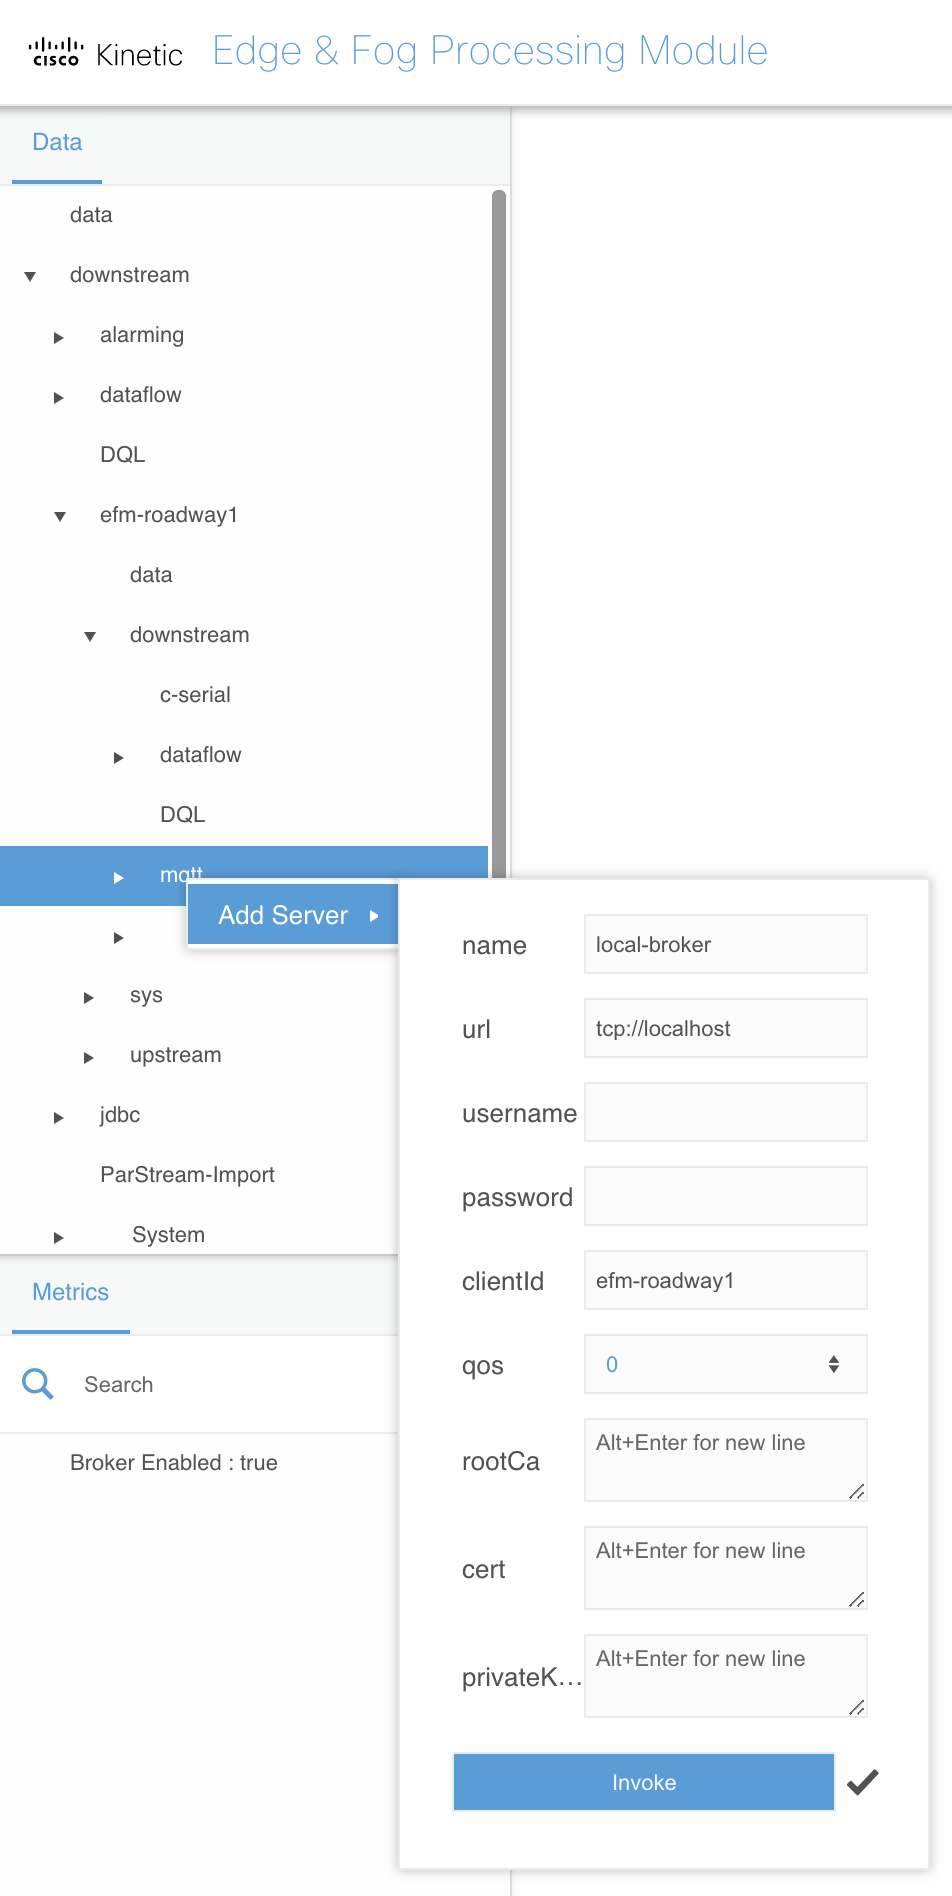
Data > downstream > efm-roadway1 > downstream > mqtt - Under
Metricsright-click onBroker Enabled: false, set the value totrue, and clickInvoke
- Right-click on
mqttand selectAdd Server - Use the following options:
- name:
local-broker - url:
tcp://localhost - clientId:
efm-roadway1 - Click
Invoke
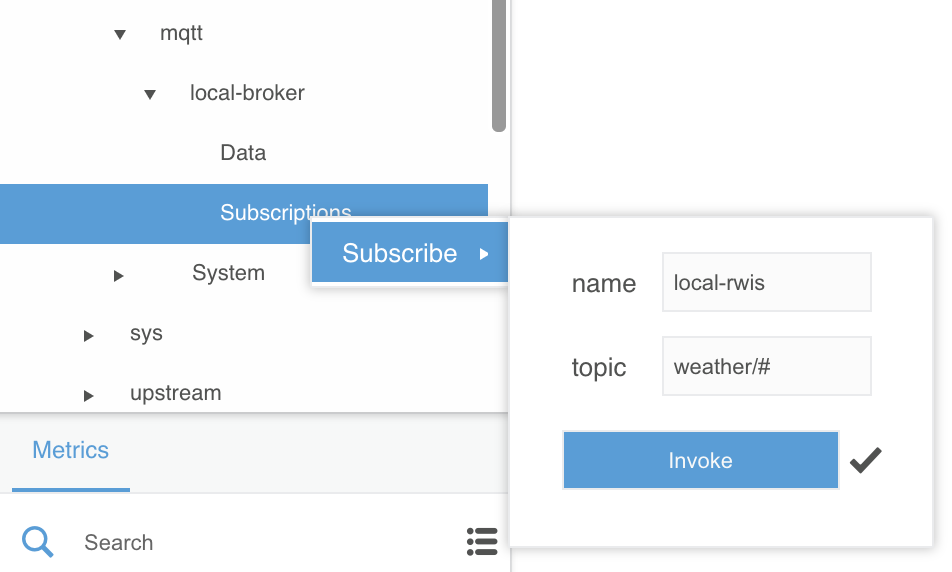
- Expand
... > mqtt > local-broker > Subscriptions
This
... >convention means to stay where you were in theDatasection, but to dive deeper into the hierarchy. It saves rewriting the entire path when you are not changing your broker focus. In this case, the...meansData > downstream > efm-roadway1 > downstream
- Right-click on
Subscriptionsand selectSubscribe - Use the following options:
- name:
local-rwis - topic:
weather/# - Click
Invoke
- Subscribe to another MQTT channel with the following options:
- name:
local-vehicles - topic:
vehicles/# - Click
Invoke
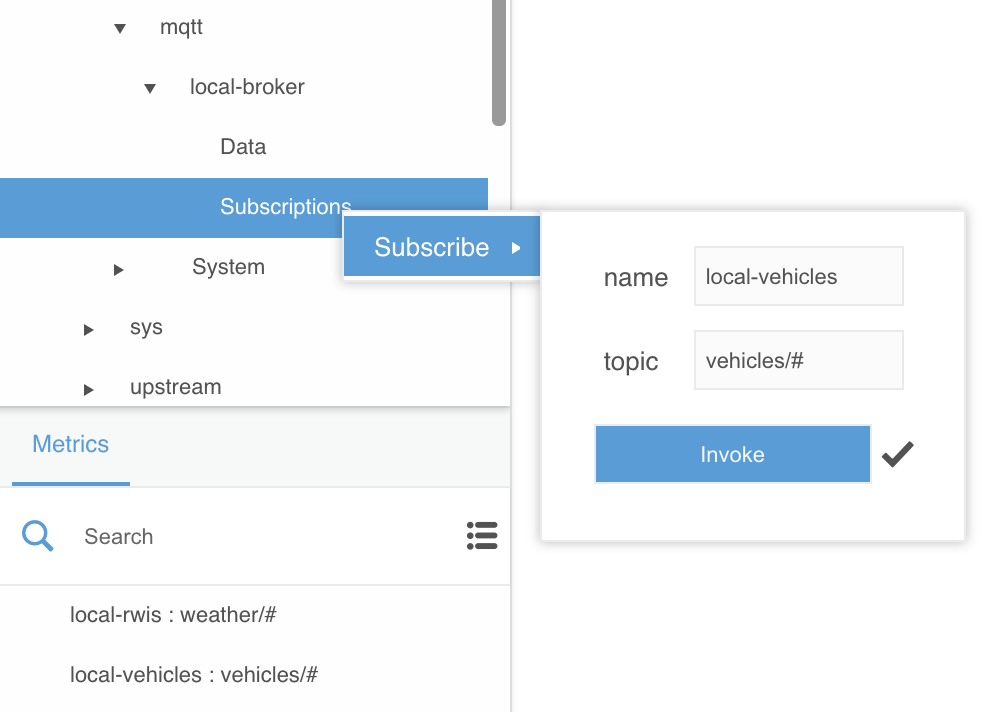
The active MQTT channel subscriptions will show up under the Metrics section.
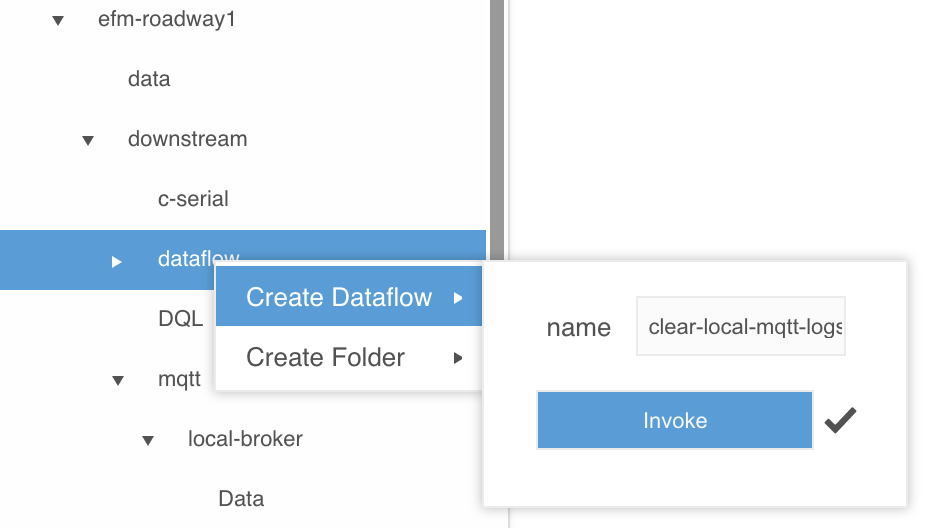
- Select
... > efm-roadway1 > downstream > dataflow - Right-click on
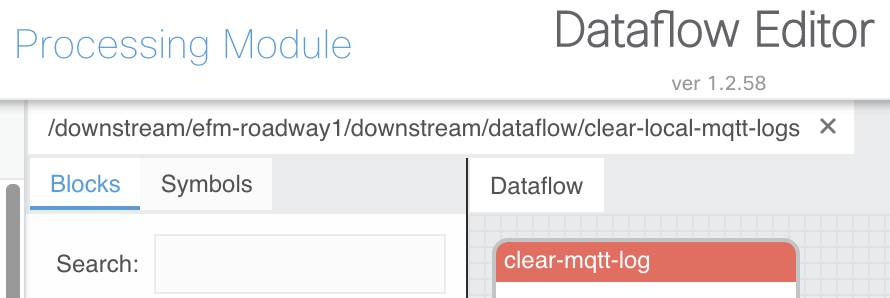
dataflowand selectCreate Dataflow - Name the dataflow
clear-local-mqtt-logsand clickInvoke
- Expand
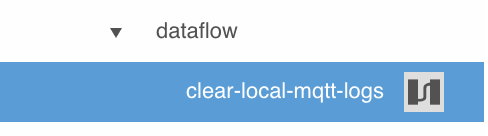
... > dataflow > clear-local-mqtt-logs - Open the
clear-local-mqtt-logsdataflow in the right-hand editor workspace by clicking on its dataflow icon
- Expand
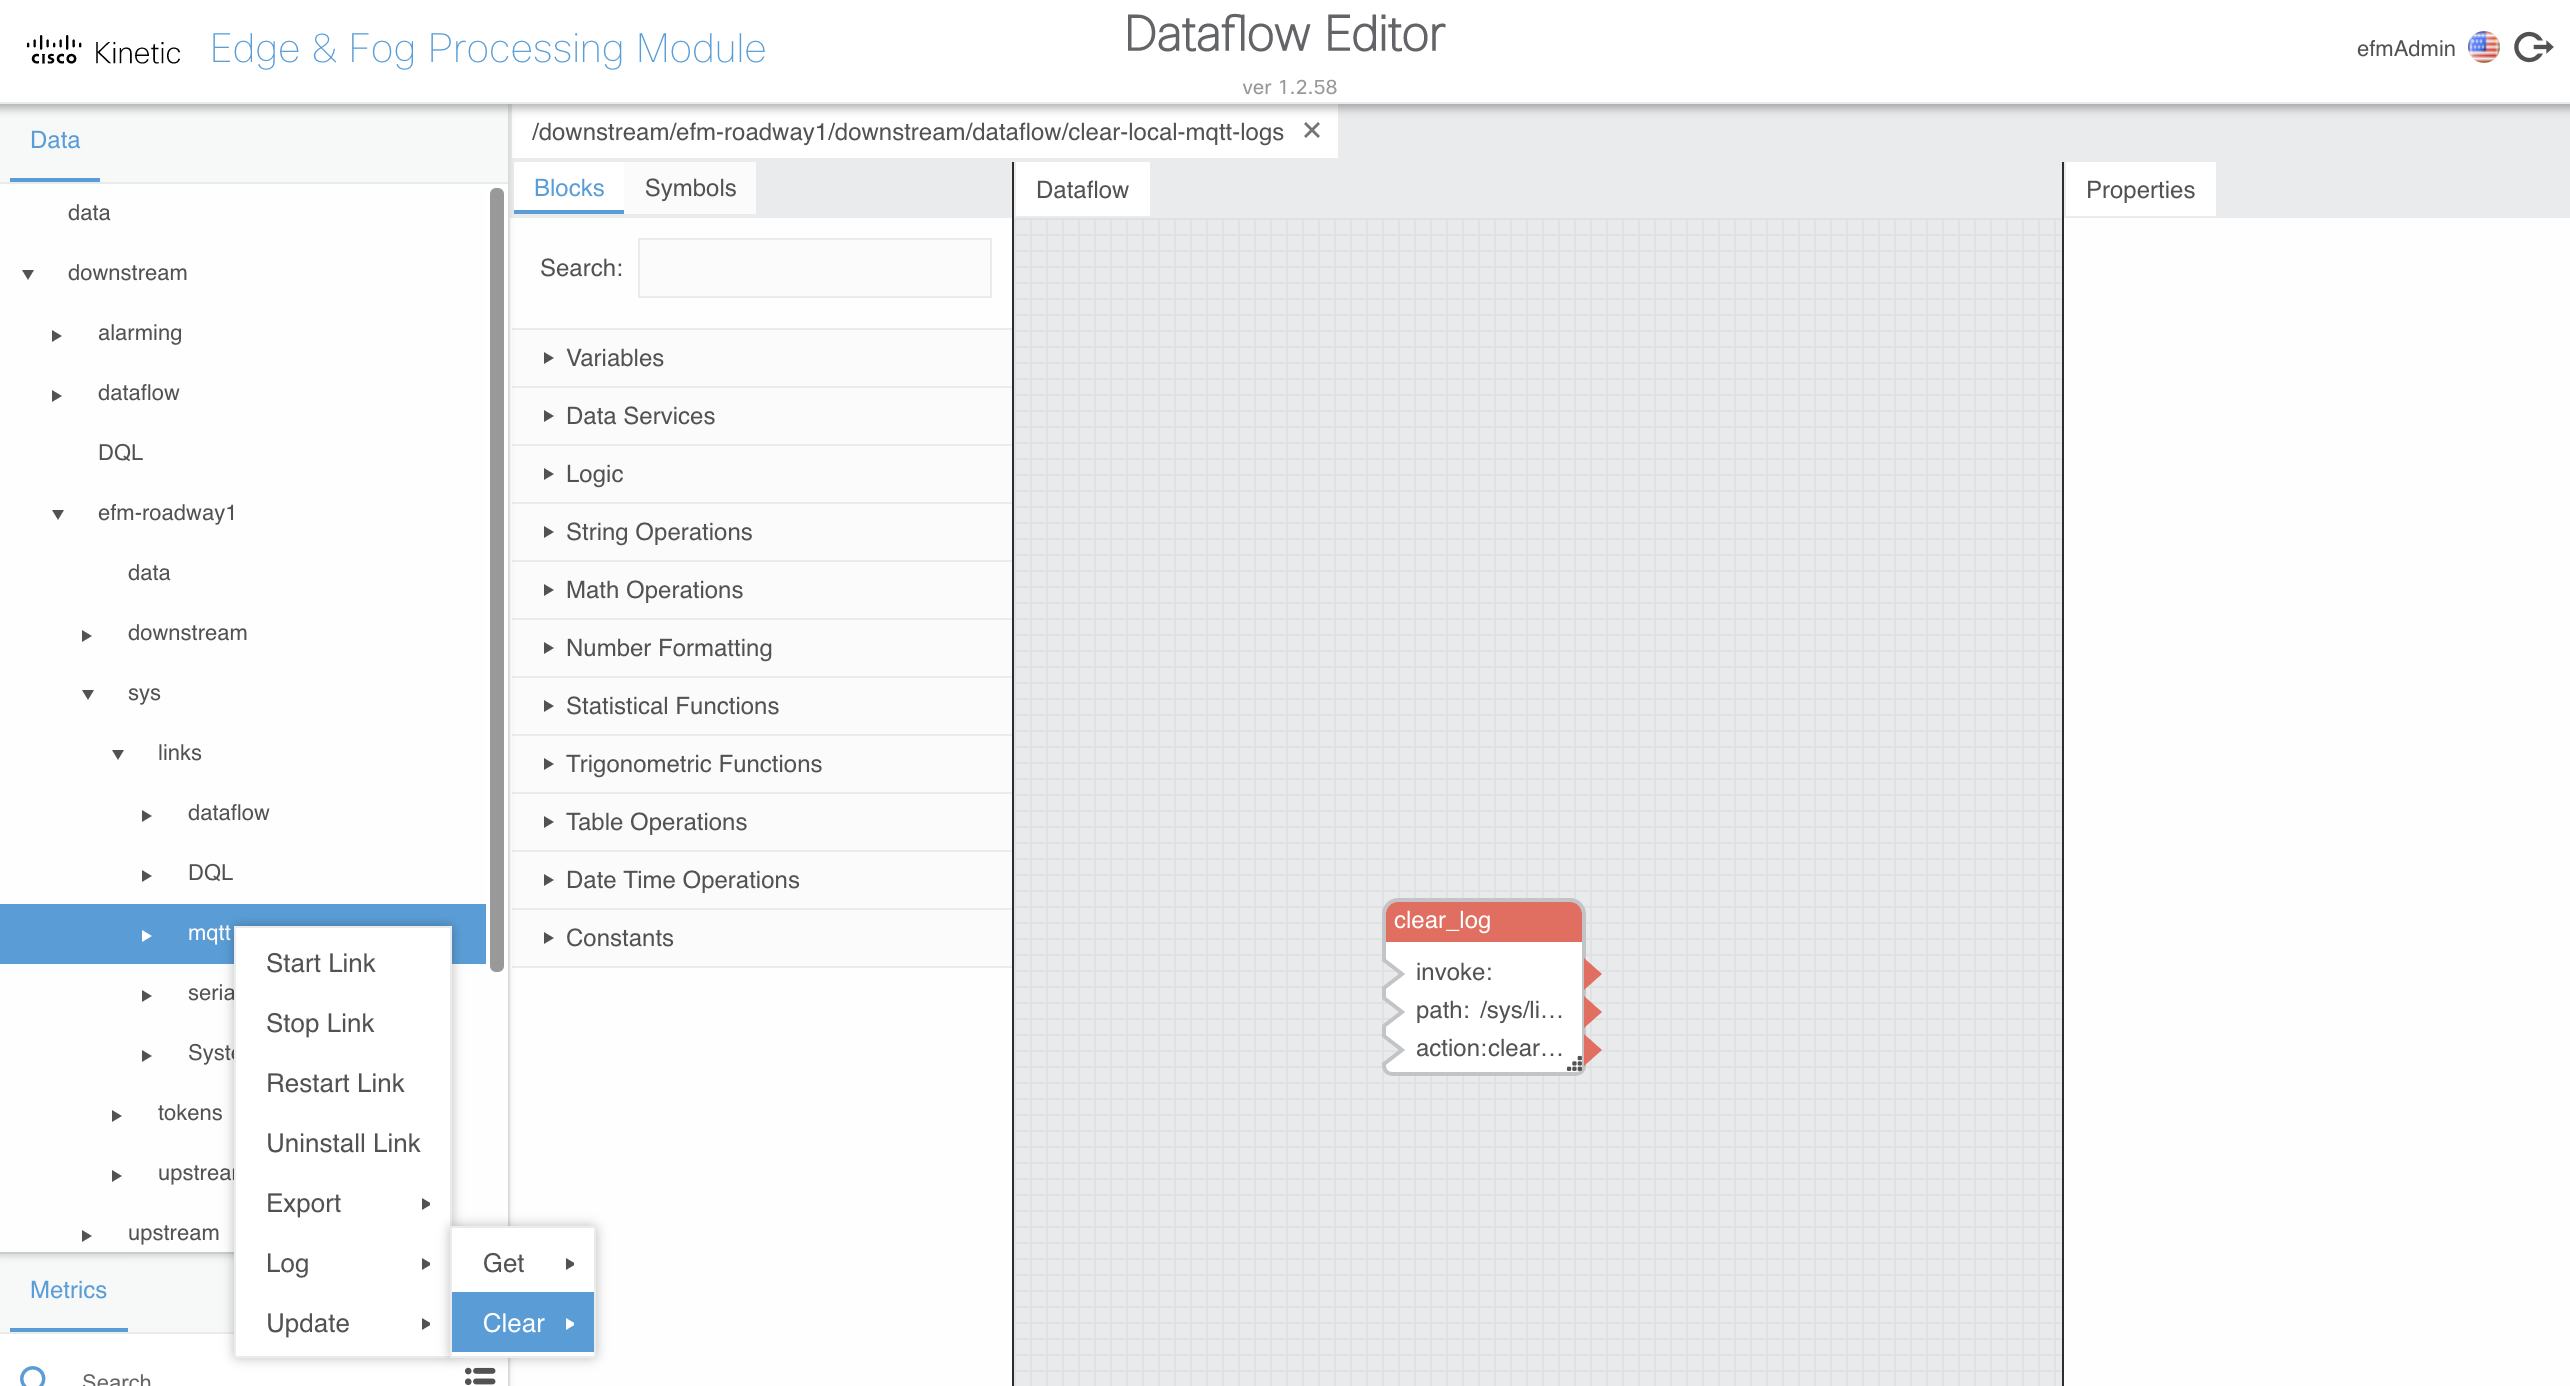
... > efm-roadway1 > sys > links > mqtt - Right-click on
mqttand dragLog > Clearto the editor workspaceDataflowsection
This is a process you will become very familiar with: dragging various functional “blocks” to the editor workspace to build a dataflow, editing their properties, and connecting their inputs and outputs. This is essentially graphical programming and as you will see can perform fairly complex logic and data operations.
- Double-click on the new block and rename
clear_logtoclear-mqtt-log - Edit the following values in the right-hand
Propertiessection:
- interval:
600 - autoRun:
true
As you likely have already figured out, this
clear-local-mqtt-logsdataflow will clear the MQTT log every 10 minutes. Without this in place the default MQTT DSLink log level would eventually fill up the small amount of storage of the IR829 EFM instance.
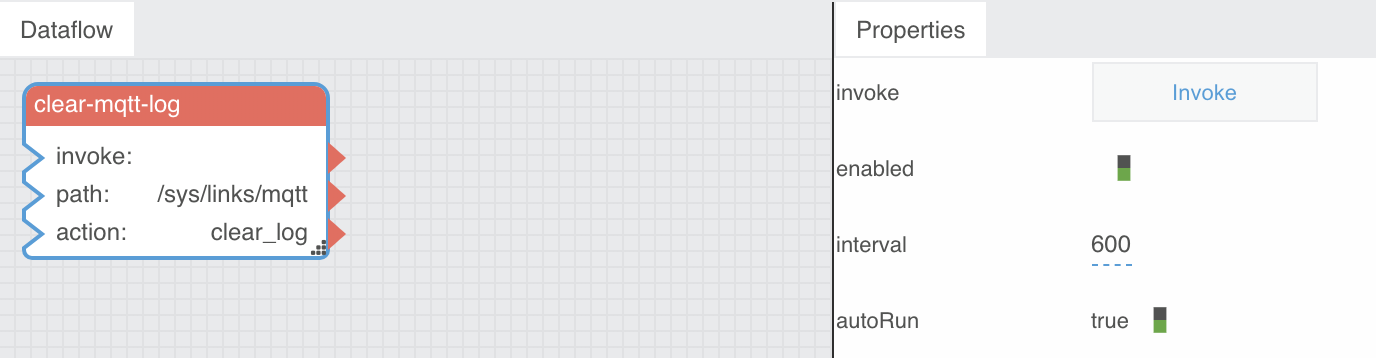
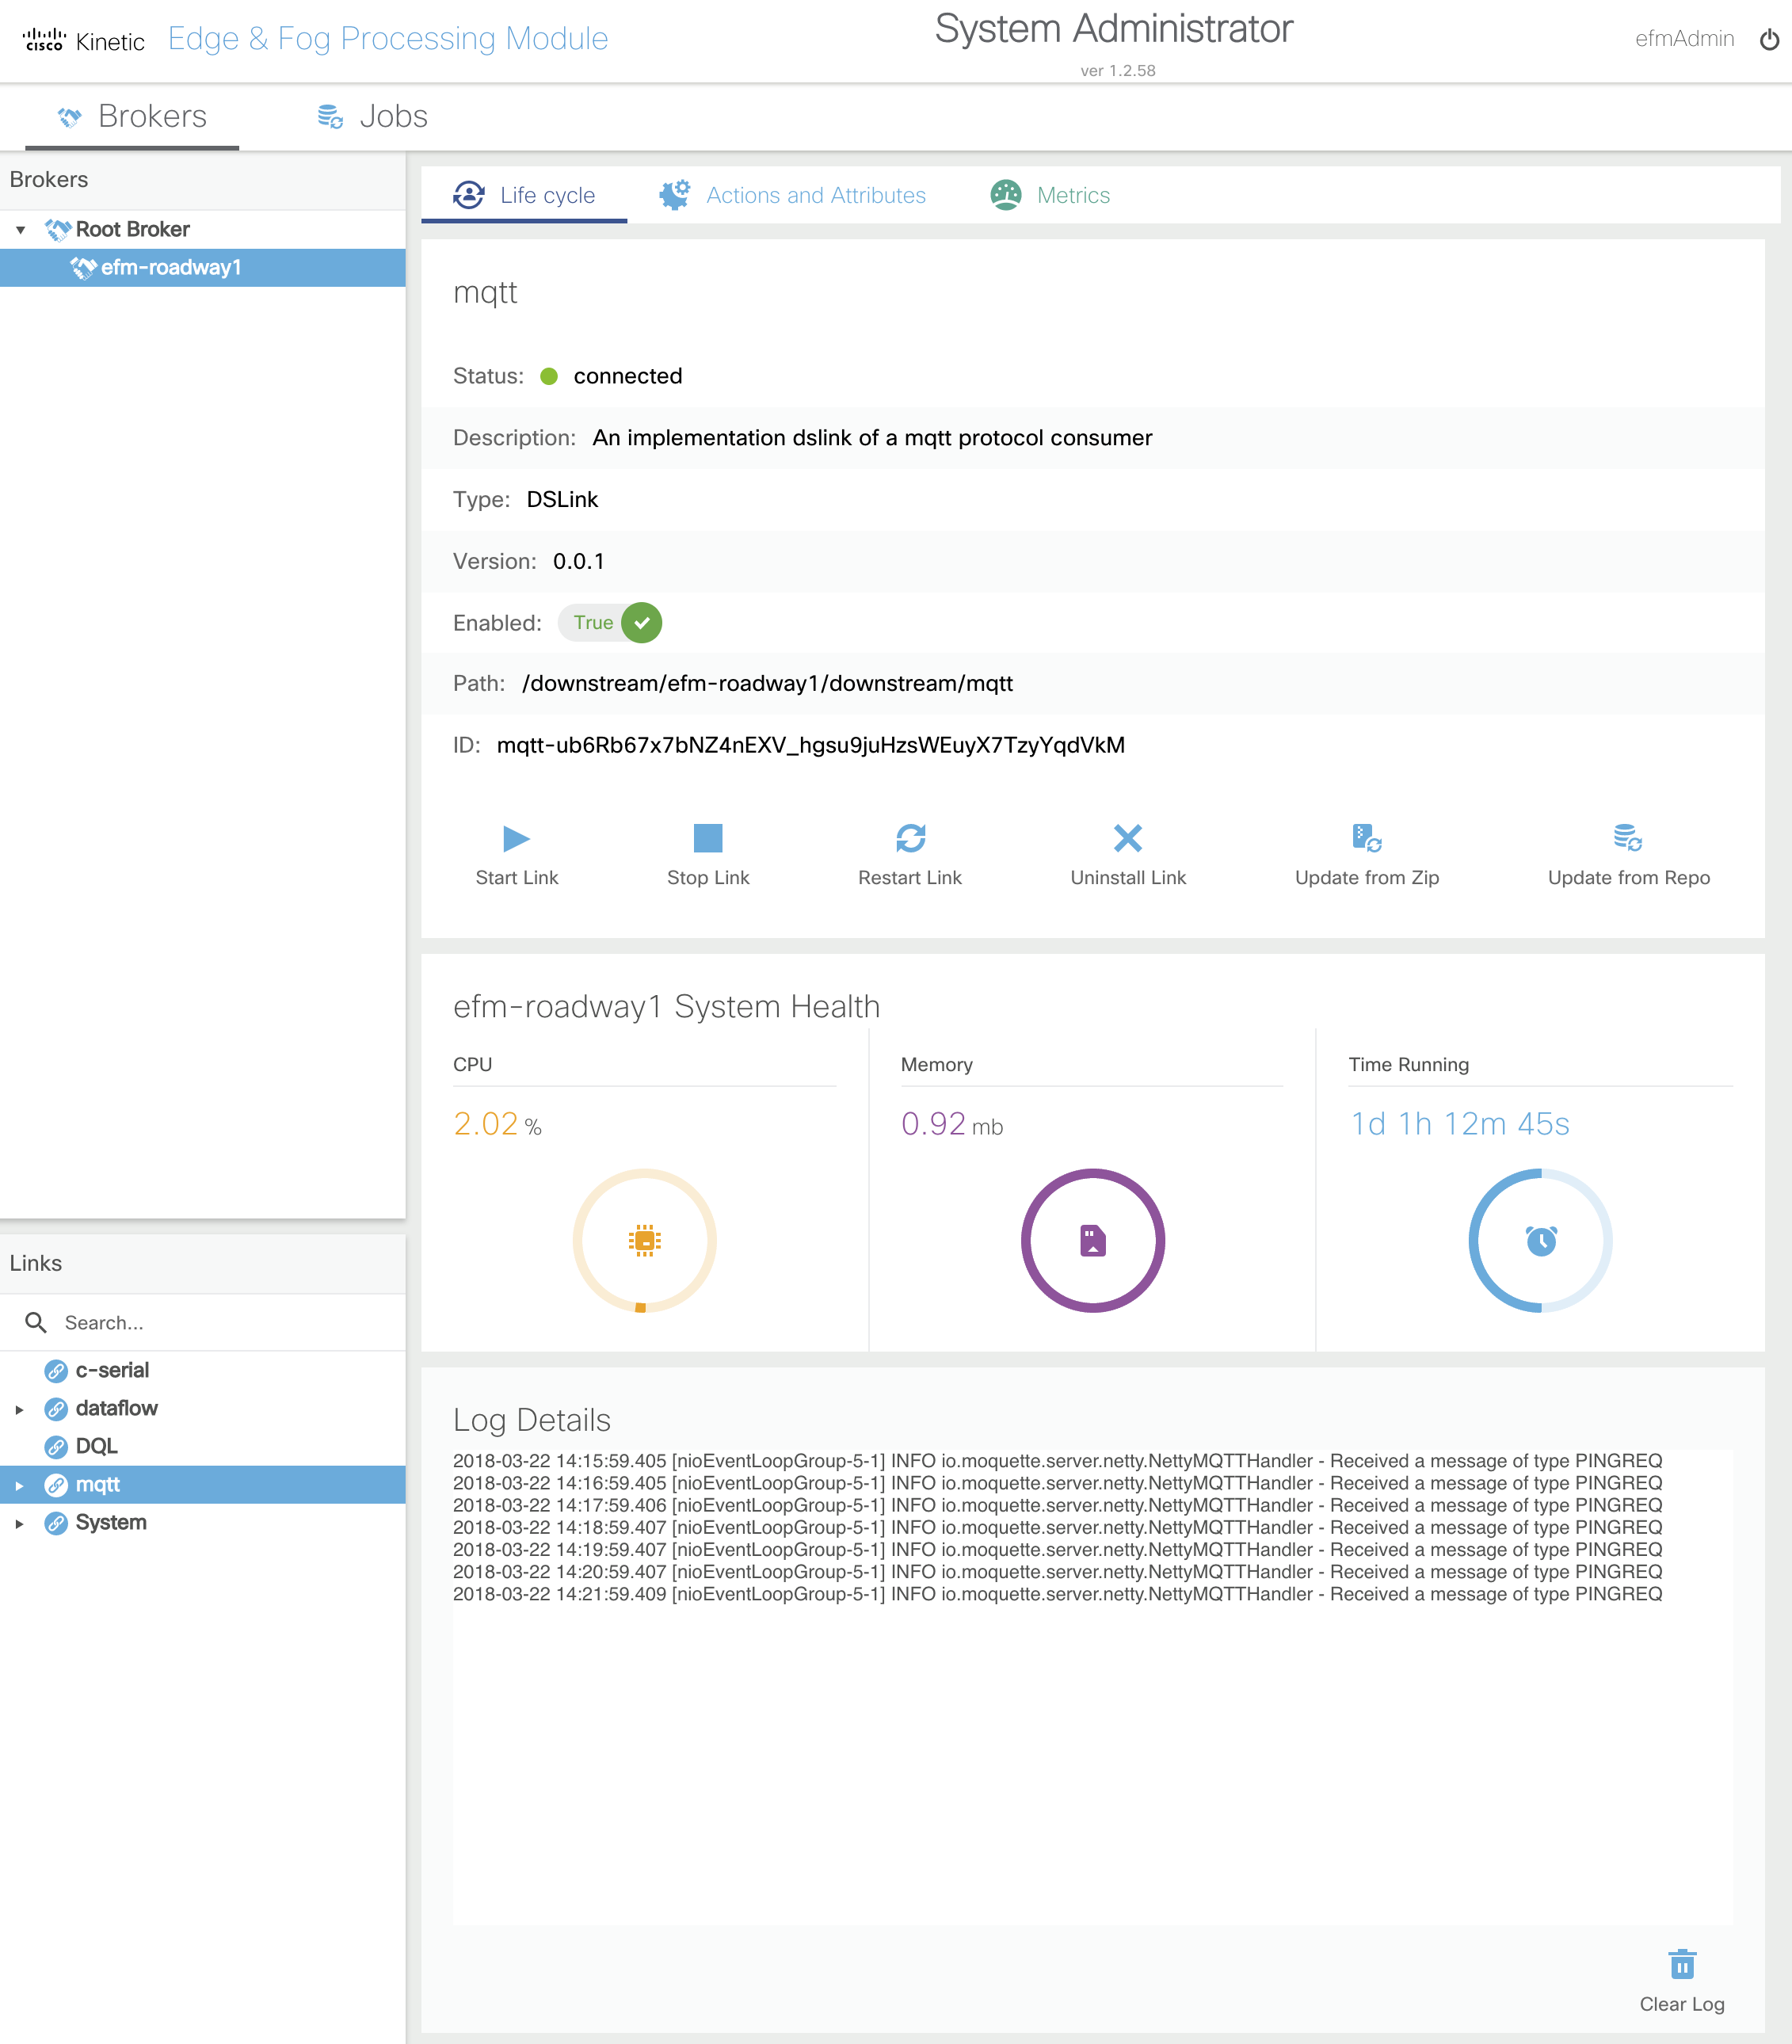
You can see this log in the EFM System Administrator under the
Life cyclesection for theefm-roadway1broker’smqttlink.
- Close the
clear-local-mqtt-logsdataflow by clicking thexicon next to its name above the editor workspace
Serial
- Navigate to
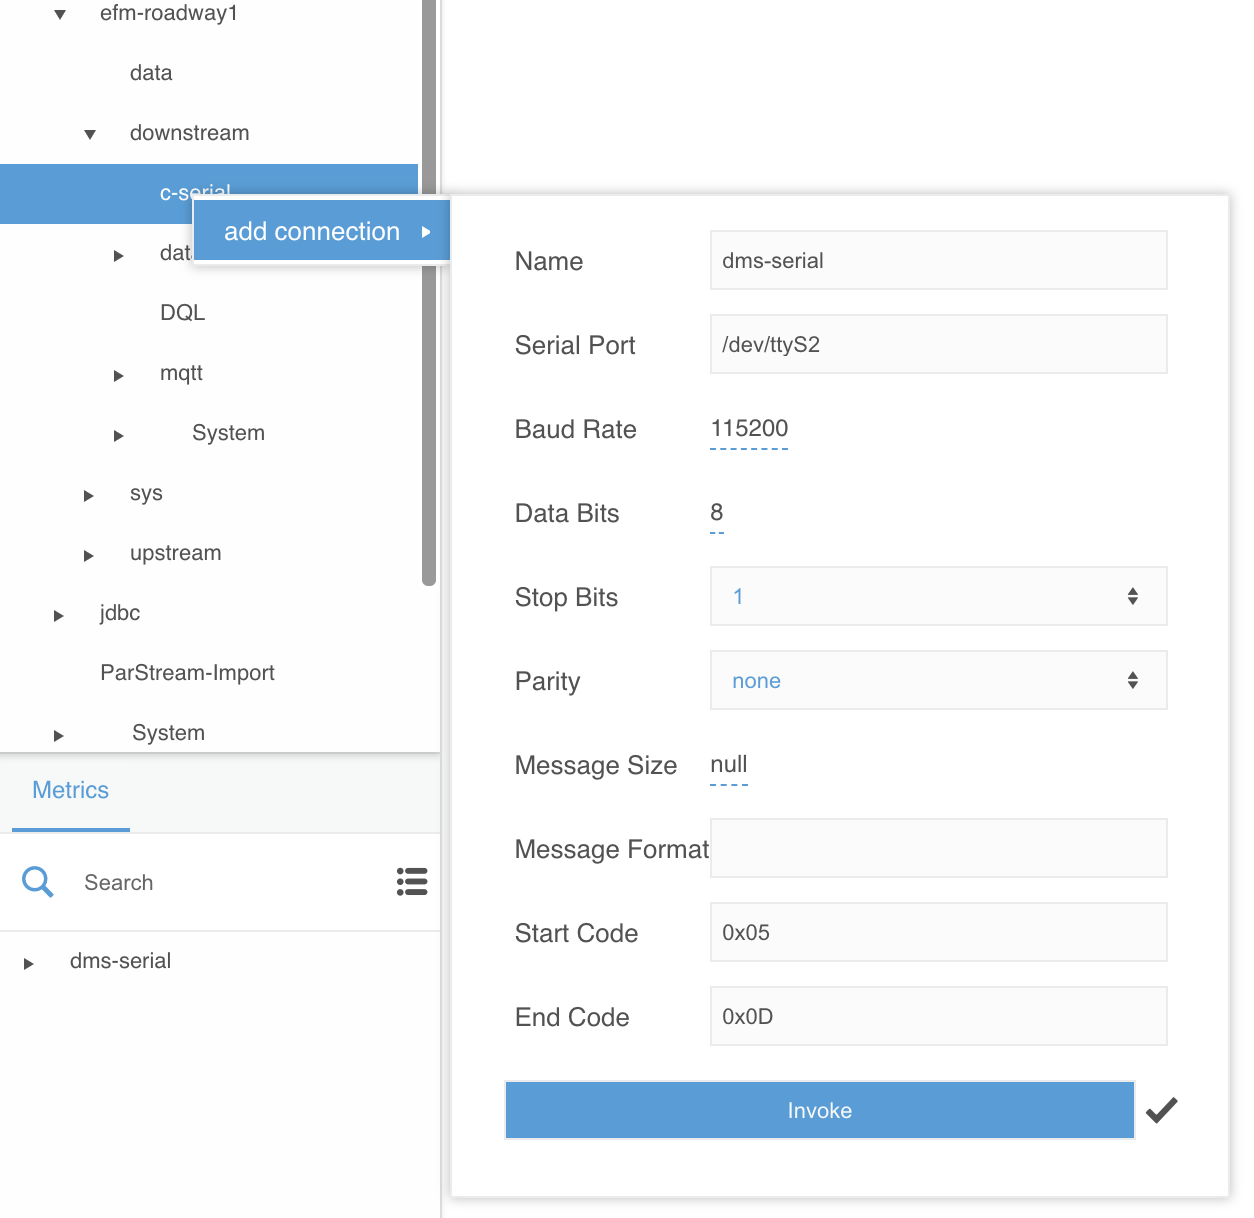
... > efm-roadway1 > downstream > c-serial - Right-click on
c-serialand selectadd connection - Use the following options:
- Name:
dms-serial - Serial Port:
/dev/ttyS2 - Baud Rate:
115200 - Data Bits:
8 - Stop Bits:
1 - Parity:
none - Message Size:
null - Message Format: (blank)
- Start Code:
0x05 - End Code:
0x0D - Click
Invoke
- Select
... > efm-roadway1 > downstream > dataflow - Right-click on
dataflowand selectCreate Dataflow - Name the dataflow
clear-local-serial-logsand clickInvoke
This is another dataflow that will clear a DSLink log. This time it’s for the Serial DSLink, but the reason and process is the same.
- Expand
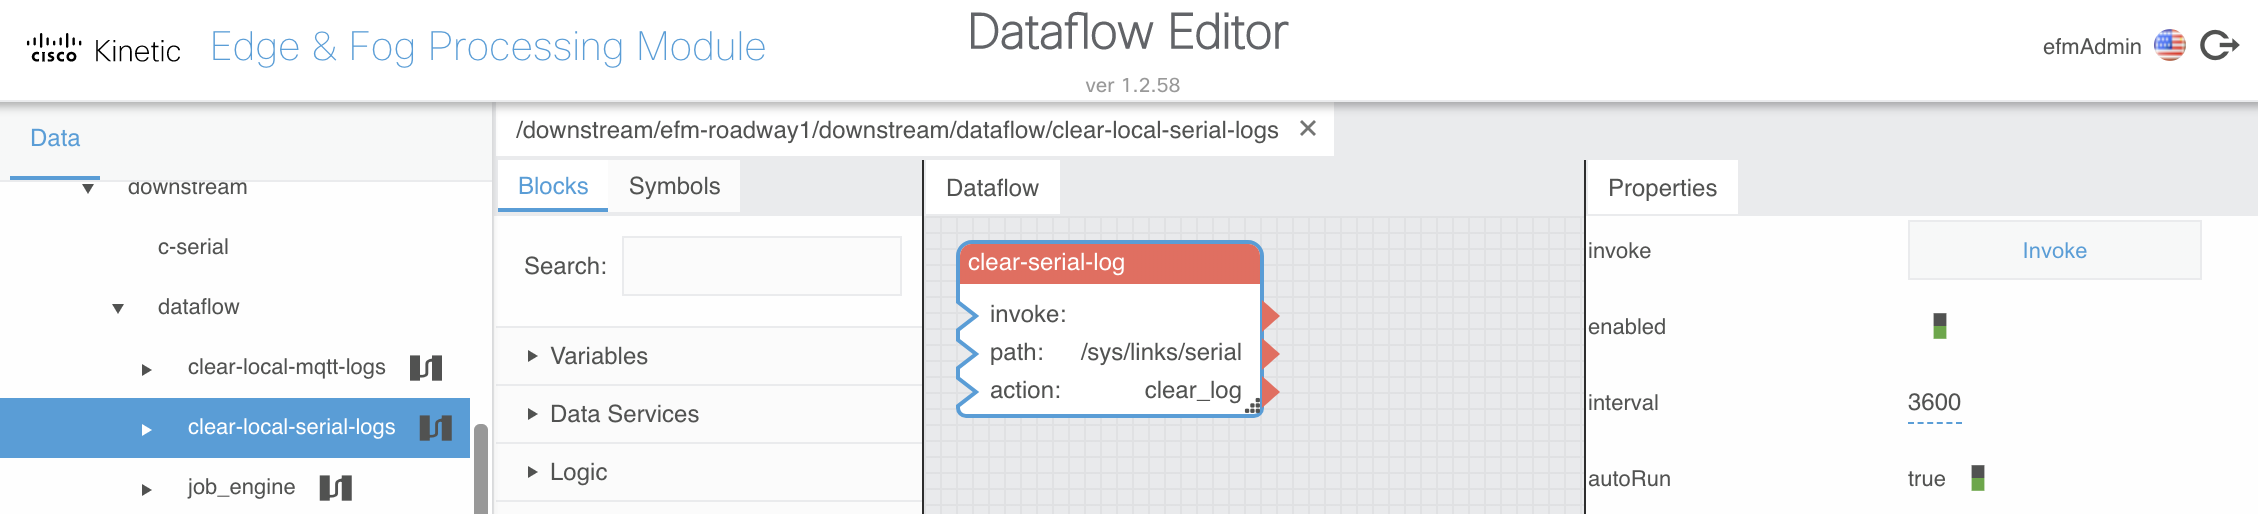
... > dataflow > clear-local-serial-logs - Open the
clear-local-serial-logsdataflow in the right-hand editor workspace by clicking on its dataflow icon - Expand
... > efm-roadway1 > sys > links > serial - Right-click on
serialand dragLog > Clearto the editor workspaceDataflowsection - Double-click on the new block and rename
clear_logtoclear-serial-log - Edit the following values in the right-hand
Propertiessection:
- interval:
3600 - autoRun:
true
Note that this time you are setting the log to clear every hour instead of every 10 minutes like with the MQTT log. This is to aid in potential serial connectivity troubleshooting.
- Close the
clear-local-serial-logsdataflow by clicking thexicon next to its name above the editor workspace
Create DOT Demo Dataflows on the Roadway Broker
Make sure the RWIS/Car Simulator and DMS are connected and running before starting this section.
Publish Local RWIS Data
- Select
... > efm-roadway1 > downstream > dataflow - Right-click on
dataflowand selectCreate Dataflow - Name the dataflow
publish-local-rwisand clickInvoke - Expand
... > dataflow > publish-local-rwis - Open the
publish-local-rwisdataflow in the right-hand editor workspace by clicking on its dataflow icon - Expand
... > efm-roadway1 > downstream > mqtt > local-broker > Data > weather
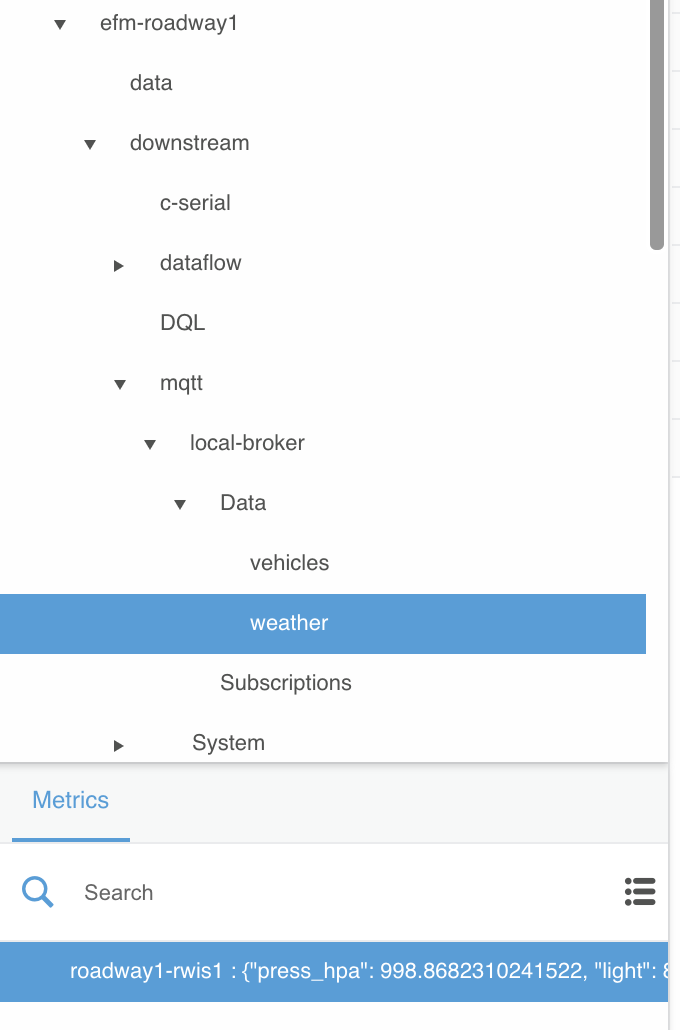
- Under the
Metricssection, dragroadway-rwis1to the editor workspaceDataflowsection
If you don’t see any data listed under
Metricsfromroadway1-rwis1go back to the Raspberry Pi RWIS and Car Simulator document and review the troubleshooting section. Make sure you have correctly set up the MQTT DSLink and MQTT configuration as detailed above as well.
If you do see
roadway-rwis1data listed, you probably noticed that it is changing every 3 seconds. The EFM Dataflow Editor shows data updates in realtime.
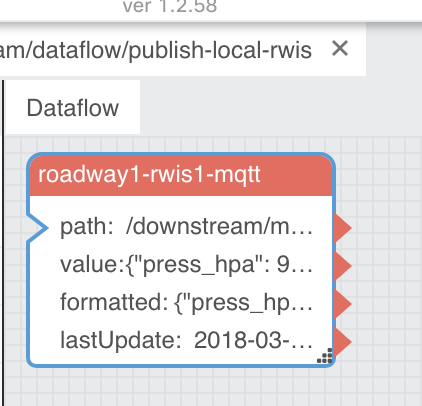
- Double-click on the new block and rename
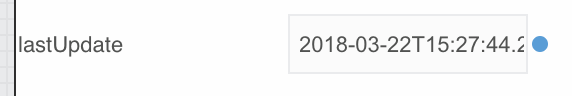
roadway1_rwis1toroadway1-rwis1-mqtt - In the right-hand
Propertiessection, mouse over thelastUpdatefield until a blue dot appears
- Click on the blue dot and check the
Pinnedbox
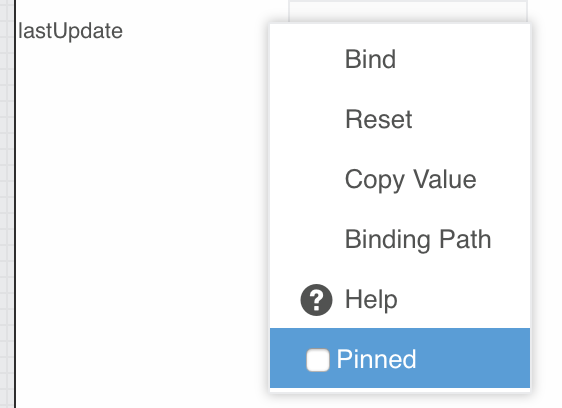
Pinning a field adds it to that block’s listed fields in the Dataflow section so it is easy to link it to an input field of other blocks.
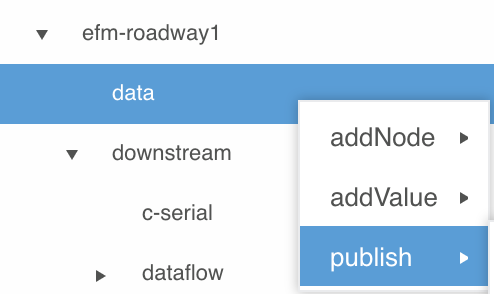
- Navigate to
... > efm-roadway1 > data - Right-click on
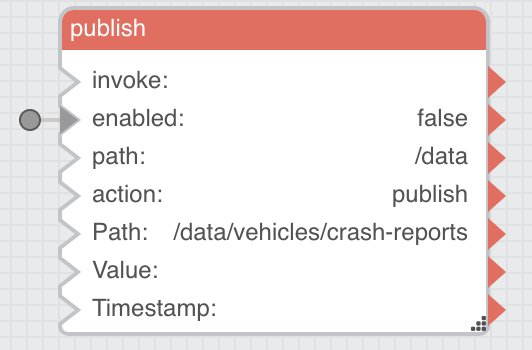
dataand dragpublishto the editor workspaceDataflowsection
- Select the new block and edit the following values in the right-hand
Propertiessection:
- autoRun:
true - Path:
/data/weather/roadway1-rwis1
Make sure you are updating the
Pathproperty toward the bottom and not thepathproperty near the middle of thePropertiessection. ThePathis how other EFM brokers are able to subscribe to the roadway broker’s published data.
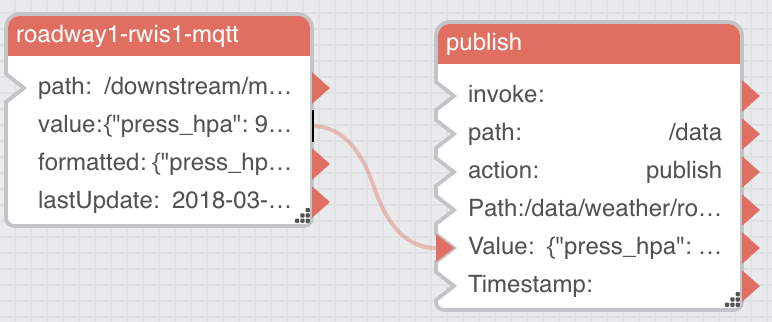
- Link the roadway1-rwis1-mqtt
valuefield to the publishValuefield by dragging the red arrowhead from one block to the open spot on the other
If you ever accidentally link the wrong fields, you can simply double-click the arrowhead and the link will be removed.
- Link the roadway1-rwis1-mqtt
lastUpdatefield to the publishTimestampfield
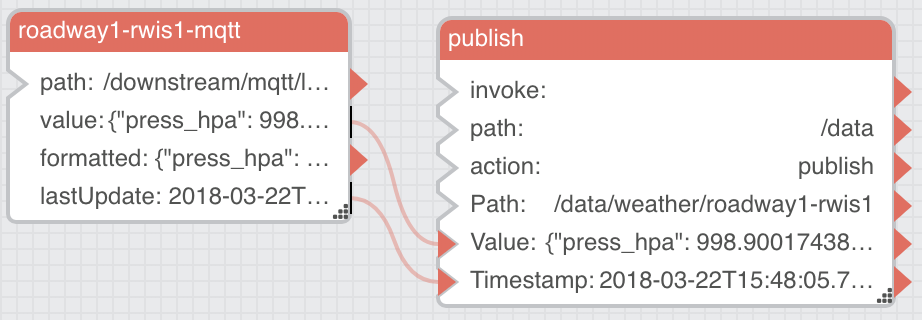
You can confirm that the data is successfully published by navigating to
... > efm-roadway1 > dataand expanding theweather > roadway1-rwis1entry under theMetricssection. The data values should change every 3 seconds, just like the source data. This is an example of how EFM can publish data upstream as it is received locally without modification. The next dataflow will add some additional filtering logic to its publish activity.
- Close the
publish-local-rwisdataflow by clicking thexicon next to its name above the editor workspace
Publish Vehicle Safety Reports
- Select
... > efm-roadway1 > downstream > dataflow - Right-click on
dataflowand selectCreate Dataflow - Name the dataflow
publish-crash-reportsand clickInvoke - Expand
... > dataflow > publish-crash-reports - Open the
publish-crash-reportsdataflow in the right-hand editor workspace by clicking on its dataflow icon - Expand
... > efm-roadway1 > downstream > mqtt > local-broker > Data > vehicles
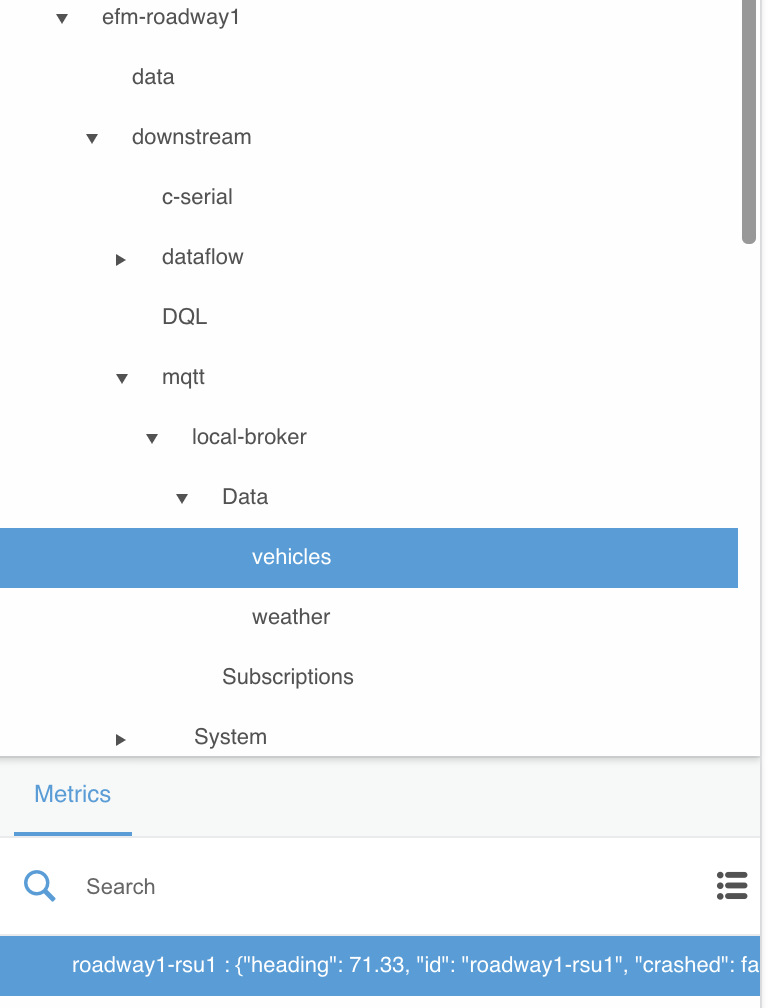
- Under the
Metricssection, dragroadway-rsu1to the editor workspaceDataflowsection
Once again, if you don’t see any data listed under
Metricsfromroadway1-rsu1go back to the Raspberry Pi RWIS and Car Simulator document and review the troubleshooting section as well as the MQTT setup sections above.
- Double-click on the new block and rename
roadway1_rsu1toroadway1-rsu1-mqtt - In the right-hand
Propertiessection, mouse over thelastUpdatefield until a blue dot appears - Click on the blue dot and check the
Pinnedbox - Under the
Blockssection, expandTable Operations - Drag
JSON Parserto the editor workspaceDataflowsection
This block will parse the JSON data that is received over MQTT and convert it into table format. Take a minute to look at all the different blocks that are available for dataflow logic and processing. As you create progressively more complex dataflows below you will become familiar with many of these blocks.
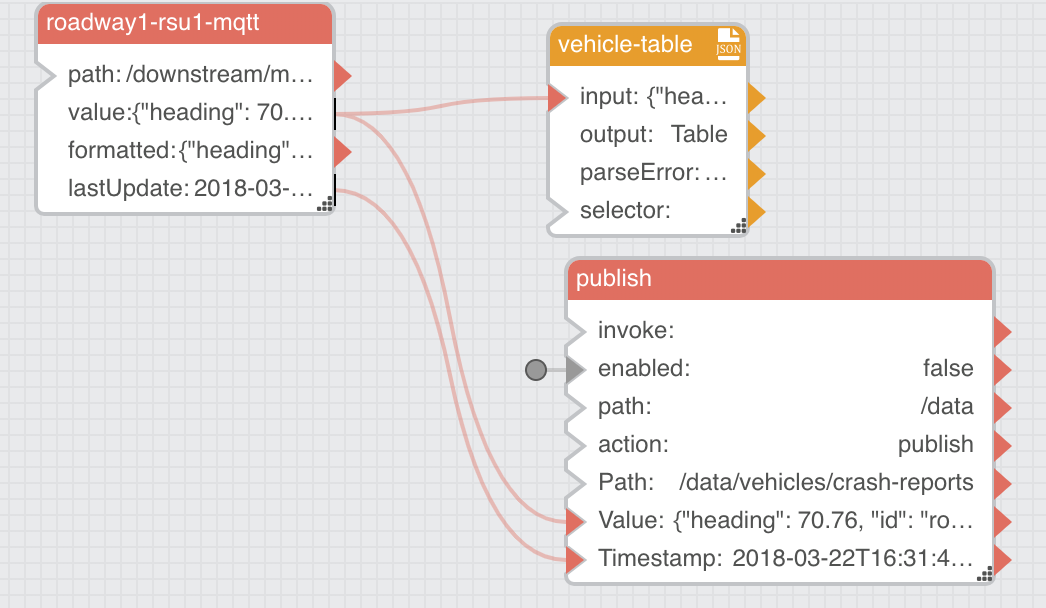
- Double-click on the new block and rename
jsonParsertovehicle-table - Link the roadway1-rsu1-mqtt
valuefield to the vehicle-tableinputfield - Navigate to
... > efm-roadway1 > data - Right-click on
dataand dragpublishto the editor workspaceDataflowsection - Select the new block and edit the following values in the right-hand
Propertiessection:
- autoRun:
true - Path:
/data/vehicles/crash-reports
- Mouse over the
enabledfield in thePropertiessection until a blue dot appears - Click on the blue dot and check the
Pinnedbox - Select
vehicle-tableand click on theTablebutton for theoutputfield in thePropertiessection to see the underlying table data
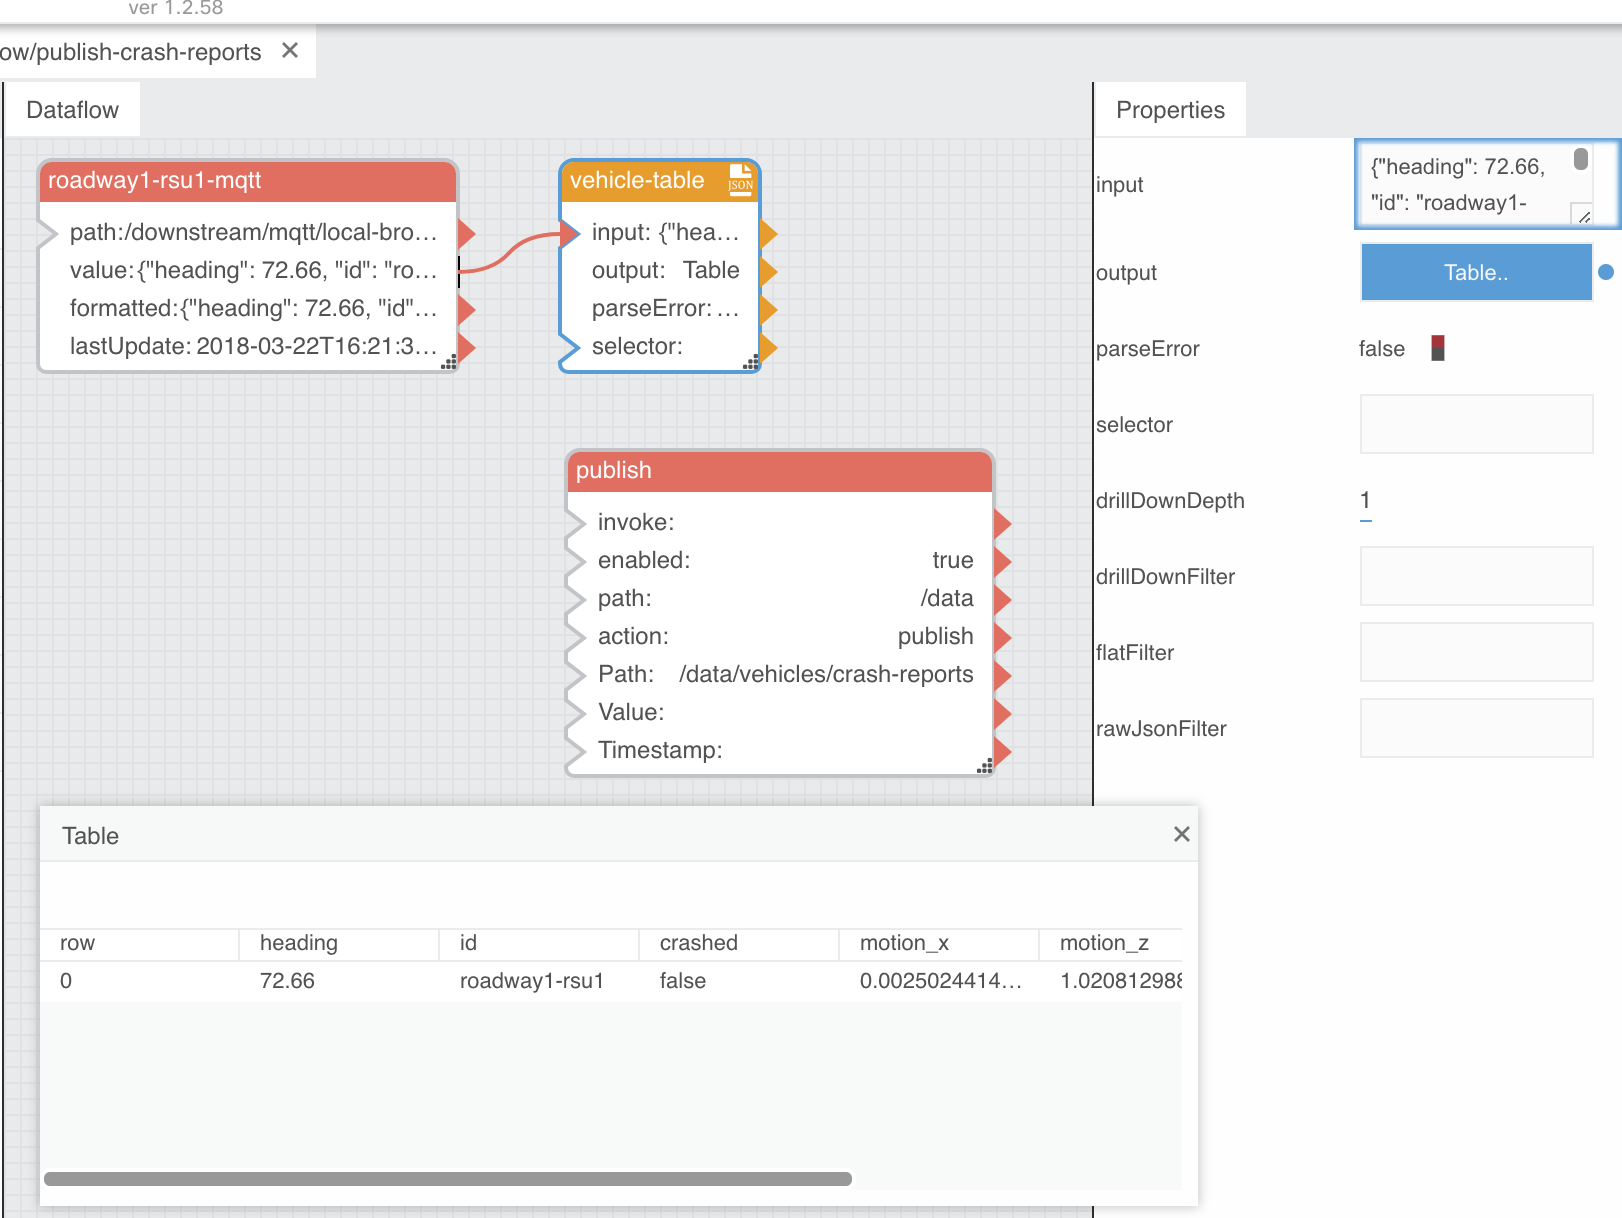
- Drag the value in row 0 for the
crashedcolumn to the publishenabledfield
The resulting field input indicator for the
publishblock will be gray with a circle indicating it’s from an external resource that can’t be easily represented graphically within the dataflow editor.
This is also how the logic of this dataflow works. The vehicle data is only published when the
crashedfield istrue.
- Close the table dialog
- Link the roadway1-rsu1-mqtt
valuefield to the publishValuefield - Link the roadway1-rsu1-mqtt
lastUpdatefield to the publishTimestampfield
- Place the Car Simulator on its side to simulate a vehicle safety event
You can confirm that the data is successfully published by navigating to
... > efm-roadway1 > dataand expanding thevehicles > crash-reportsentry under theMetricssection. The data values should change every second, but only when the Car Simulator is not sitting flat on its rubber feet. You can confirm this within thepublish-crash-reportsdataflow as well, watching theenabledfield in thepublishblock, which should change totrueduring simulated vehicle safety events and stayfalseotherwise.
This is an example of how EFM can intelligently filter large input data streams locally before they are published upstream. The next dataflow will use even more logic to tie local RWIS visibility data to local DMS output completely at the roadway.
- Close the
publish-crash-reportsdataflow by clicking thexicon next to its name above the editor workspace
Local RWIS-DMS Integration
- Select
... > efm-roadway1 > downstream > dataflow - Right-click on
dataflowand selectCreate Dataflow - Name the dataflow
local-rwis-dmsand clickInvoke - Expand
... > dataflow > local-rwis-dms - Open the
local-rwis-dmsdataflow in the right-hand editor workspace by clicking on its dataflow icon - Expand
... > efm-roadway1 > downstream > mqtt > local-broker > Data > weather - Under the
Metricssection, dragroadway-rwis1to the editor workspaceDataflowsection - Double-click on the new block and rename
roadway1_rwis1toroadway1-rwis1-mqtt - Under the
Blockssection, dragTable Operations > JSON Parserto the editor workspaceDataflowsection - Double-click on the new block and rename
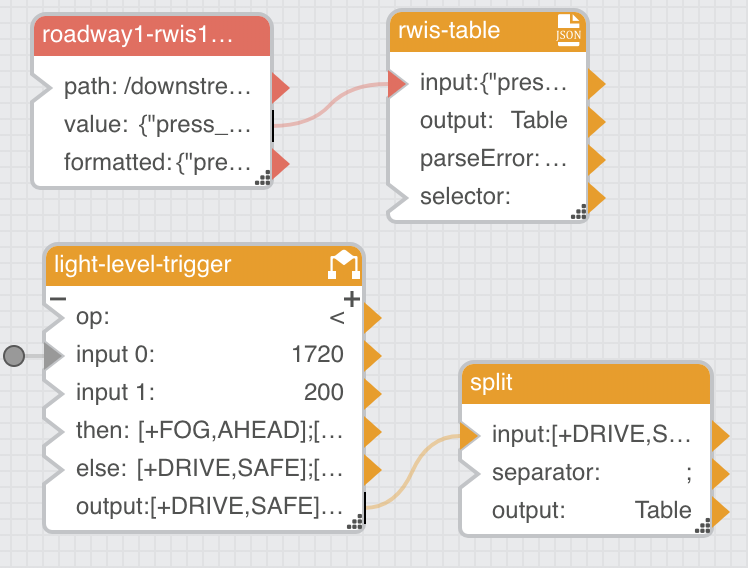
jsonParsertorwis-table - Link the roadway1-rwis1-mqtt
valuefield to the rwis-tableinputfield - Under the
Blockssection, dragLogic > Ifto the editor workspaceDataflowsection - Double-click on the new block and rename
Iftolight-level-trigger - Select
rwis-tableand click on theTablebutton for theoutputfield in thePropertiessection to see the underlying table data - Drag the value in row 0 for the
lightcolumn to the light-level-triggerinput 0field - Close the table dialog
- Select
light-level-triggerand edit the following values in the right-handPropertiessection:
- op:
< - input 1:
200 - then:
[+FOG,AHEAD];[+USE,CAUTION] - else:
[+DRIVE,SAFE];[+DRIVE,SAFE]
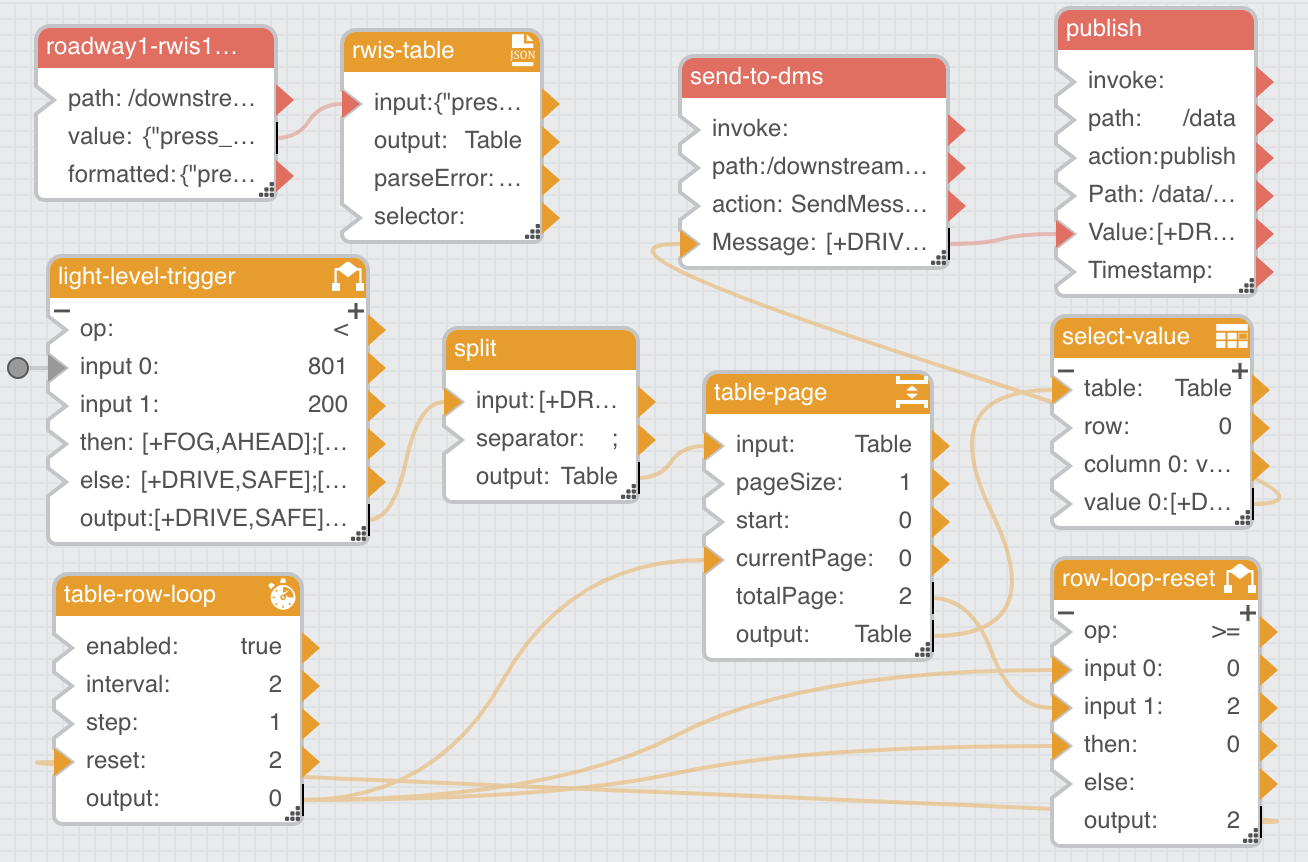
This one
ifblock is providing the main logic for this dataflow. It is evaluating the RWIS light level and setting the message to be displayed on the DMS for either low or regular visibility. The rest of the dataflow takes this output, sends it to the DMS over serial, and publishes the DMS state upstream.
Most dataflows can be broken down logically to an “input-logic-output” cycle. It can be helpful to keep this in mind when trying to understand more complex dataflows. You may have also noticed that data-oriented dataflow blocks (usually used for input and output) are red while logic and operations blocks are orange.
- Under the
Blockssection, dragString Operations > Splitto the editor workspaceDataflowsection - Select the
splitblock and edit the following values in the right-handPropertiessection:
- separator:
;
- Link the light-level-trigger
outputfield to the splitinputfield
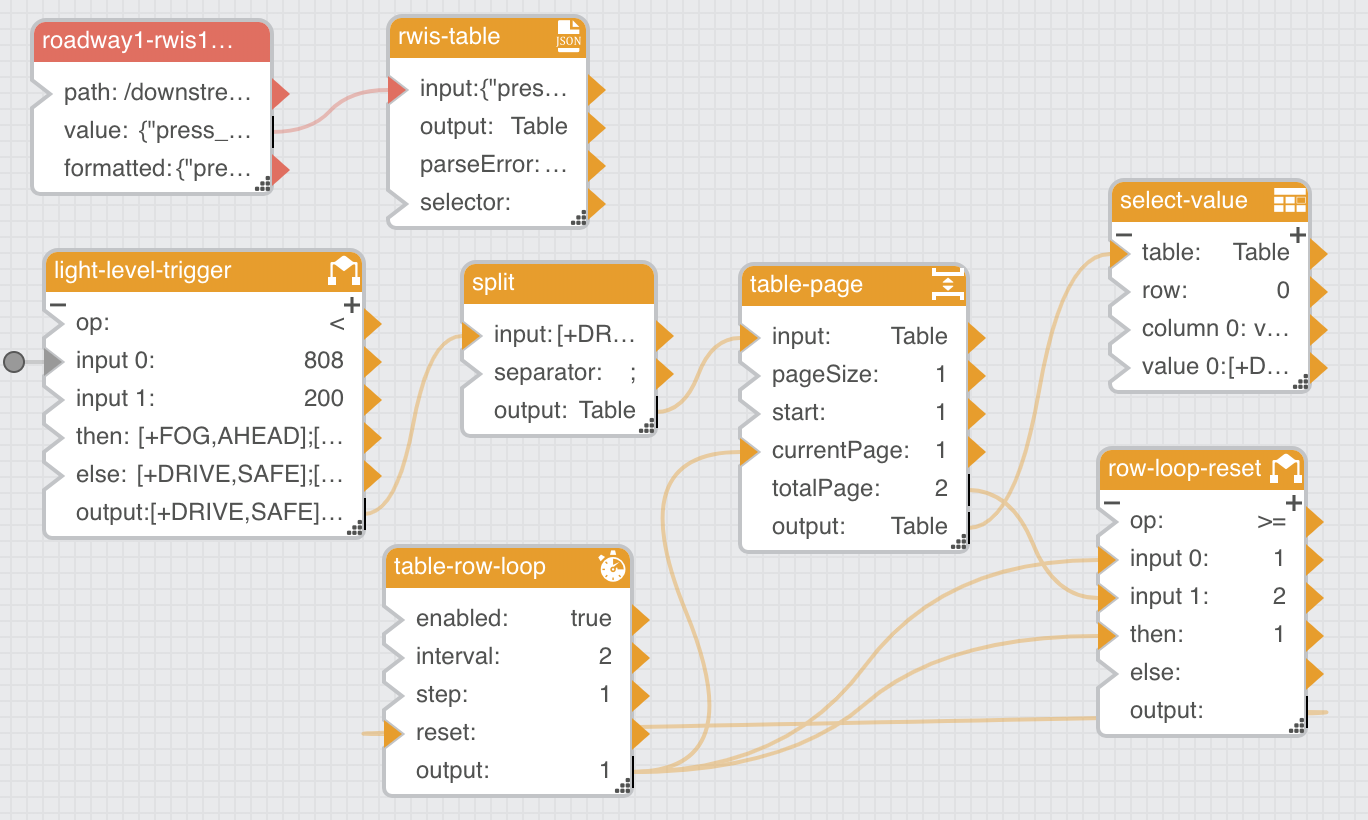
- Under the
Blockssection, dragTable Operations > Pageto the editor workspaceDataflowsection - Double-click on the new block and rename
tablePagetotable-page - Select
table-pageand edit the following values in the right-handPropertiessection:
- pageSize:
1
- Mouse over the
currentPagefield, click the blue dot, and check thePinnedbox - Mouse over the
totalPagefield, click the blue dot, and check thePinnedbox - Link the split
outputfield to the table-pageinputfield - Under the
Blockssection, dragLogic > Stop Watchto the editor workspaceDataflowsection - Double-click on the new block and rename
stopwatchtotable-row-loop - Select
table-row-loopand edit the following values in the right-handPropertiessection:
- enabled:
true - interval:
2
- Mouse over the
resetfield, click the blue dot, and check thePinnedbox - Link the table-row-loop
outputfield to the table-pagecurrentPagefield - Under the
Blockssection, dragLogic > Ifto the editor workspaceDataflowsection - Double-click on the new block and rename
if1torow-loop-reset - Select
row-loop-resetand edit the following values in the right-handPropertiessection:
- op:
>=
- Link the table-row-loop
outputfield to the row-loop-resetinput 0field - Link the table-page
totalPagefield to the row-loop-resetinput 1field - Link the table-row-loop
outputfield to the row-loop-resetthenfield - Link the row-loop-reset
outputfield to the table-row-loopresetfield - Under the
Blockssection, dragTable Operations > Table Row Cellsto the editor workspaceDataflowsection - Double-click on the new block and rename
tableRowCellstoselect-value - Select
select-valueand edit the following values in the right-handPropertiessection:
- row:
0 - column 0:
value
- Link the table-page
outputfield to the select-valuetablefield
- Navigate to
... > efm-roadway1 > downstream > c-serial - Under the
Metricssection, right-click ondms-serialand dragsend messageto the editor workspaceDataflowsection
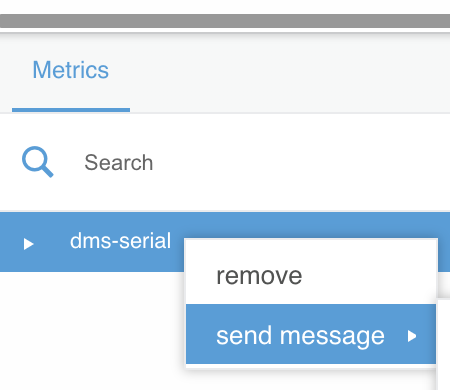
- Double-click on the new block and rename
SendMessagetosend-to-dms - Select
send-to-dmsand edit the following values in the right-handPropertiessection:
- autoRun:
true
- Link the select-value
value 0field to the send-to-dmsMessagefield
The DMS should have just changed its display from the 3 green lights to
DRIVE SAFEin orange.
- Navigate to
... > efm-roadway1 > data - Right-click on
dataand dragpublishto the editor workspaceDataflowsection - Select the new block and edit the following values in the right-hand
Propertiessection:
- autoRun:
true - Path:
/data/dms/roadway1-dms1
- Link the send-to-dms
Messagefield to the publishValuefield
- Cover up the RWIS to simulate a visibility event and check that the DMS display cycles through
FOG AHEADandUSE CAUTION - Remove the RWIS cover and the display should reset to
DRIVE SAFE
If the DMS isn’t updating, review the troubleshooting steps outlined in Raspberry Pi Serial DMS , the Serial DSLink setup on the roadway broker, and the IR829 IOS and IOx serial port configuration.
- Close the
local-rwis-dmsdataflow by clicking thexicon next to its name above the editor workspace
Create DOT Demo Dataflows on the Regional Broker
Connect to the ParStream Server
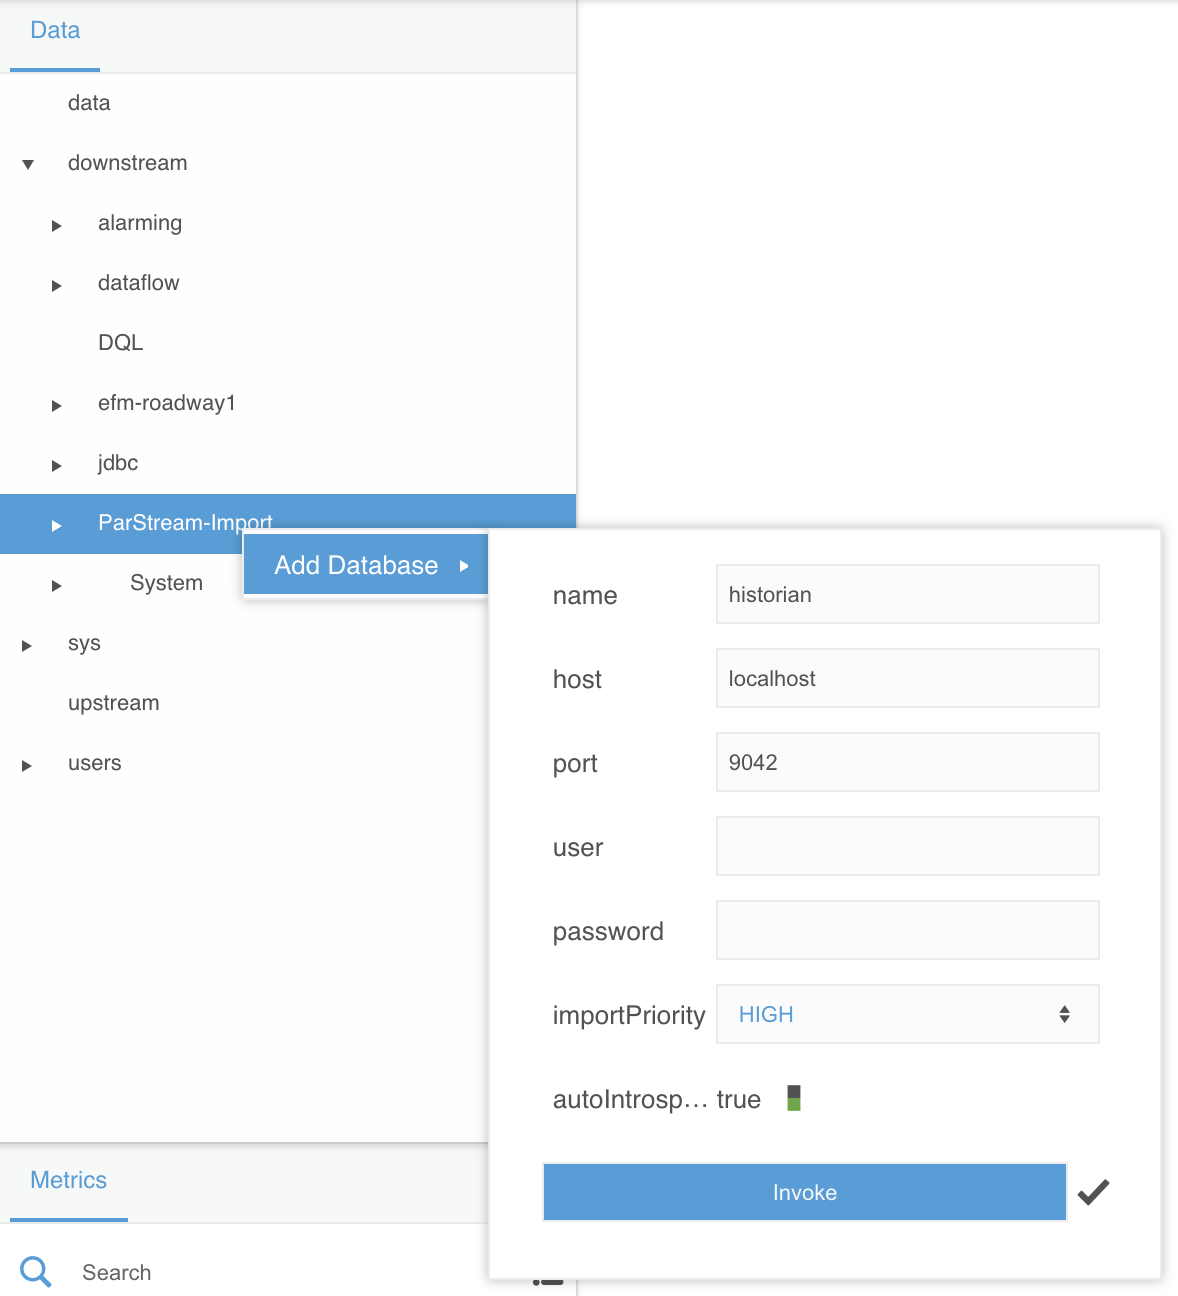
- Navigate to
Data > downstream > ParStream-Import - Right-click on
ParStream-Importand selectAdd Database - Use the following options:
- name:
historian - host:
localhost - port:
9042 - user: (blank)
- password: (blank)
- importPriority:
HIGH - autoIntrospect:
true - click
Invoke
Save All Crash Data to ParStream
- Select
Data > downstream > dataflow
We are creating these next dataflows on the regional broker, which is where the ParStream database resides and where the ParStream connection is configured above. This makes sense given the main purpose of the regional broker is to aggregate the data from roadway brokers.
- Right-click on
dataflowand selectCreate Dataflow - Name the dataflow
save-all-crash-dataand clickInvoke - Expand
... > dataflow > save-all-crash-data - Open the
save-all-crash-datadataflow in the right-hand editor workspace by clicking on its dataflow icon - Under the
Blockssection, dragTable Operations > JSON Parserto the editor workspaceDataflowsection - Double-click on the new block and rename
jsonParsertoparsed-crash-data - Navigate to
... > downstream > DQL - Right-click on
DQLand dragQueryto the editor workspaceDataflowsection
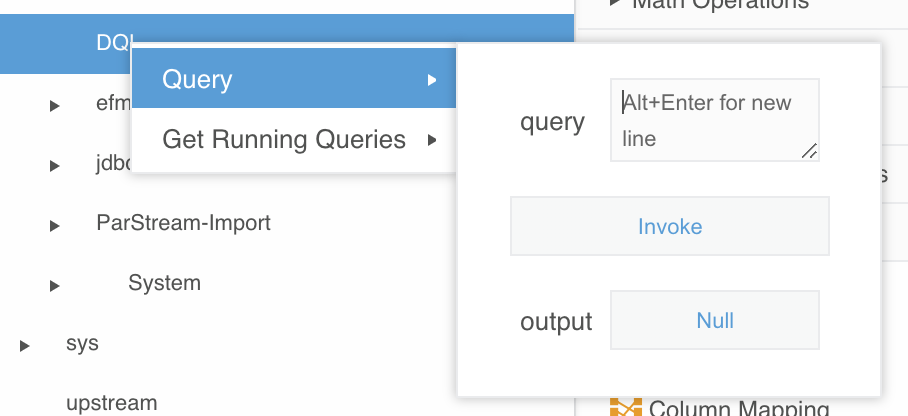
- Double-click on the new block and rename
querytoget-all-crash-data - Select
get-all-crash-dataand edit the following values in the right-handPropertiessection:
- interval:
30 - query:
list brokers | sublist /data/vehicles/ | filter :name="crash-reports" | subscribe value.timestamp as timestamp, value
This is Distributed Query Language (DQL), which provides a powerful, flexible way to extract published data throughout all the brokers within an EFM deployment. This particular DQL query gets any
crash-reportsdata published by any broker the regional broker knows about. In this demo environment, the only other broker is the roadside broker you configured above.
- Click the
Invokebutton associated with theinvokefield - Click the
Tablebutton associated with theoutputfield - Drag the value in row 0 for the
valuecolumn to the parsed-crash-datainputfield
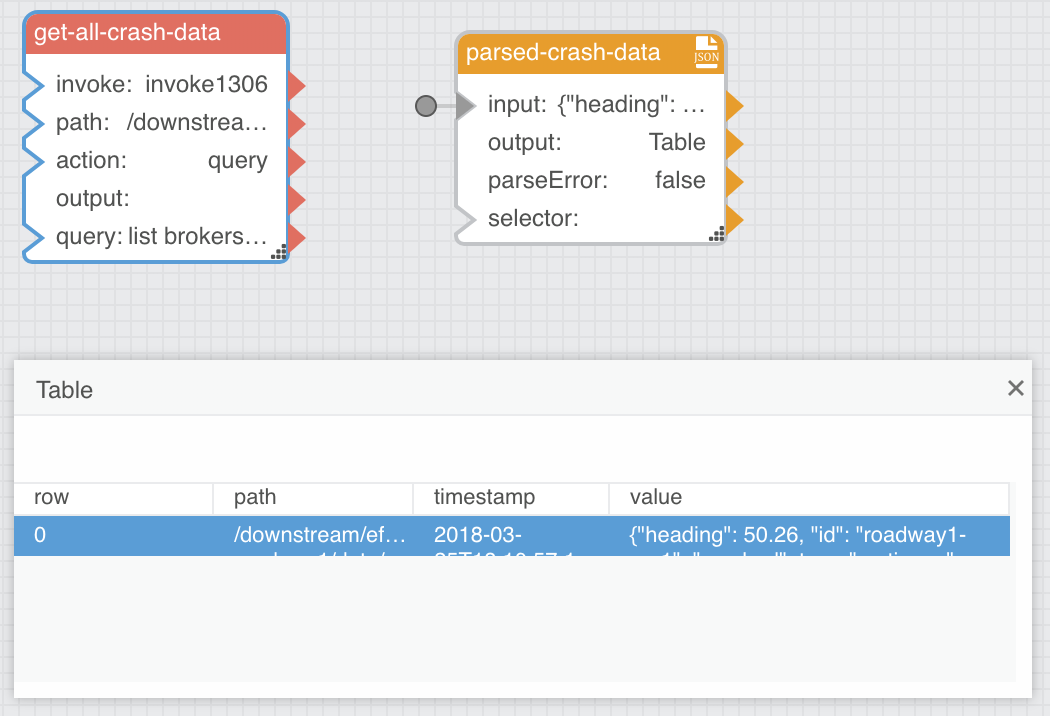
If you don’t see any data in the table, turn the Car Simulator on its side to have it send crash data.
- Close the table
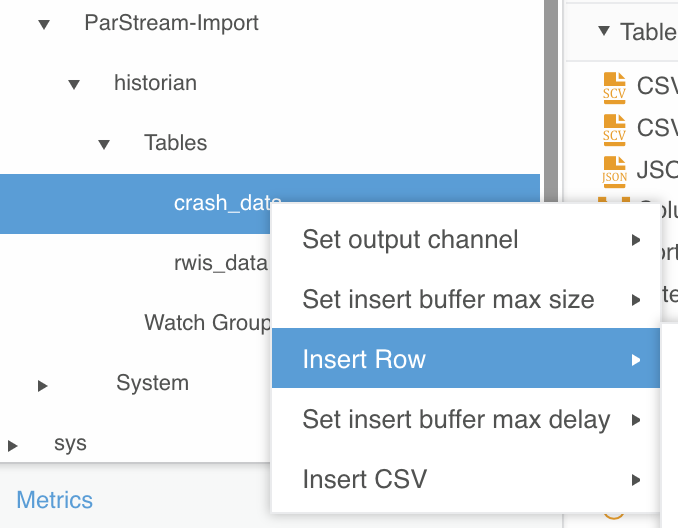
- Navigate to
... > downstream > ParStream-Import > historian > Tables > crash_data
If you don’t see the
crash_datatable listed, right-click onhistorianand selectIntrospectand then check again.
- Right-click on
crash_dataand dragInsert Rowto the editor workspaceDataflowsection
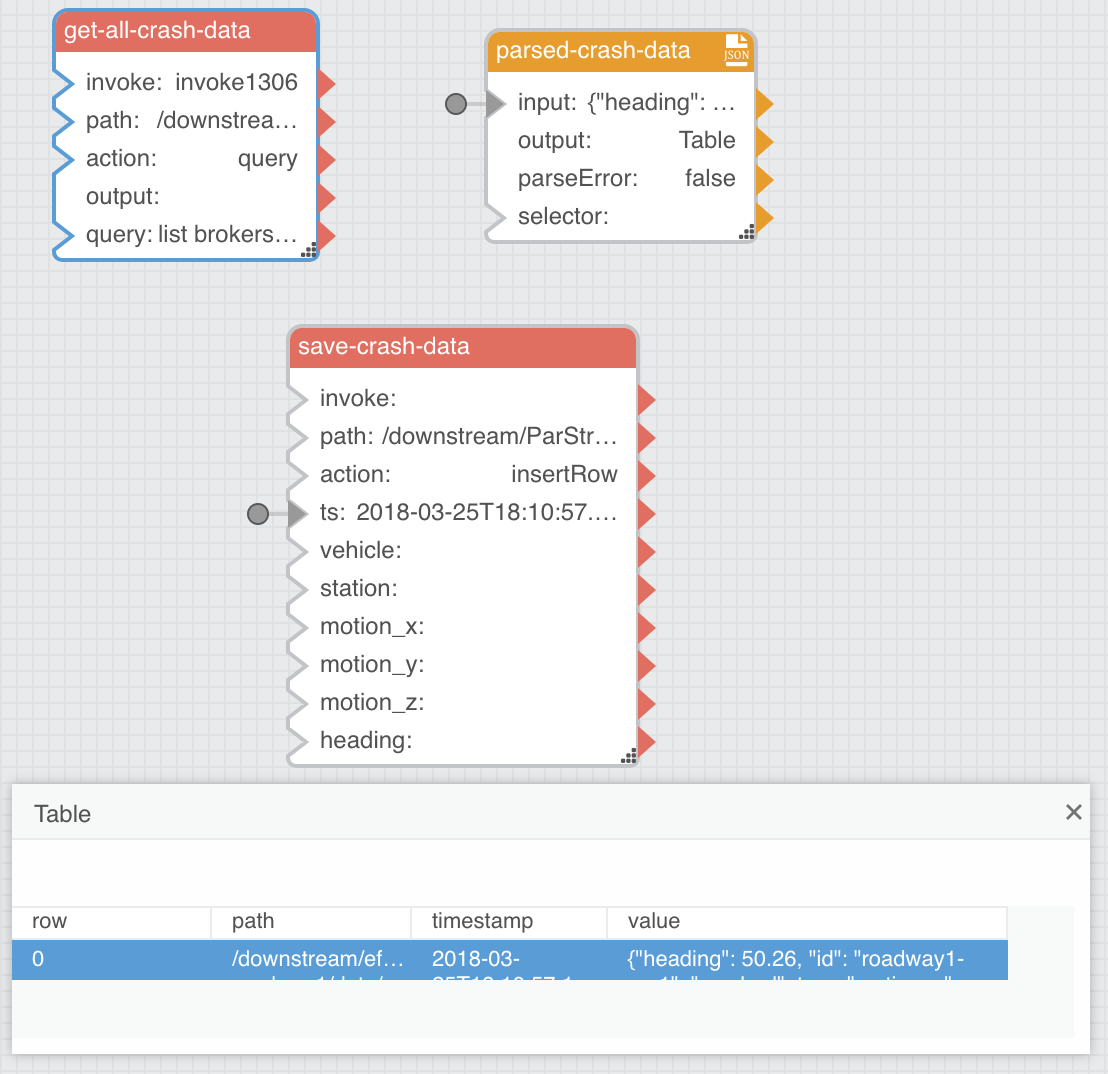
- Double-click on the new block and rename
insertRowtosave-crash-data - Select
save-crash-dataand edit the following values in the right-handPropertiessection:
- autoRun:
true
- Select
get-all-crash-dataand click theTablebutton associated with theoutputfield in thePropertiessection - Drag the value in row 0 for the
timestampcolumn to the save-crash-datatsfield
- Close the table
- Select
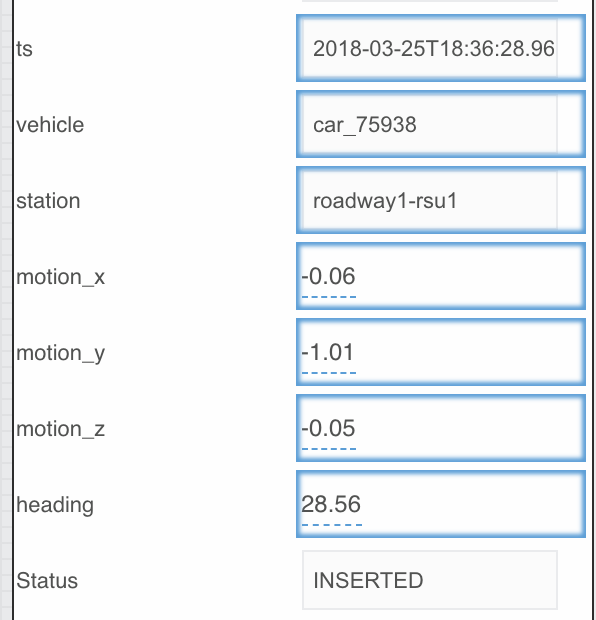
parsed-crash-dataand click theTablebutton associated with theoutputfield in thePropertiessection - Link the table values in row 0 to the associated column field inputs for
save-crash-data
- Drag the
idvalue to the save-crash-datastationfield - Drag the
vehiclevalue to the save-crash-datavehiclefield - Drag the
motion_xvalue to the save-crash-datamotion_xfield - Drag the
motion_yvalue to the save-crash-datamotion_yfield - Drag the
motion_zvalue to the save-crash-datamotion_zfield - Drag the
headingvalue to the save-crash-dataheadingfield
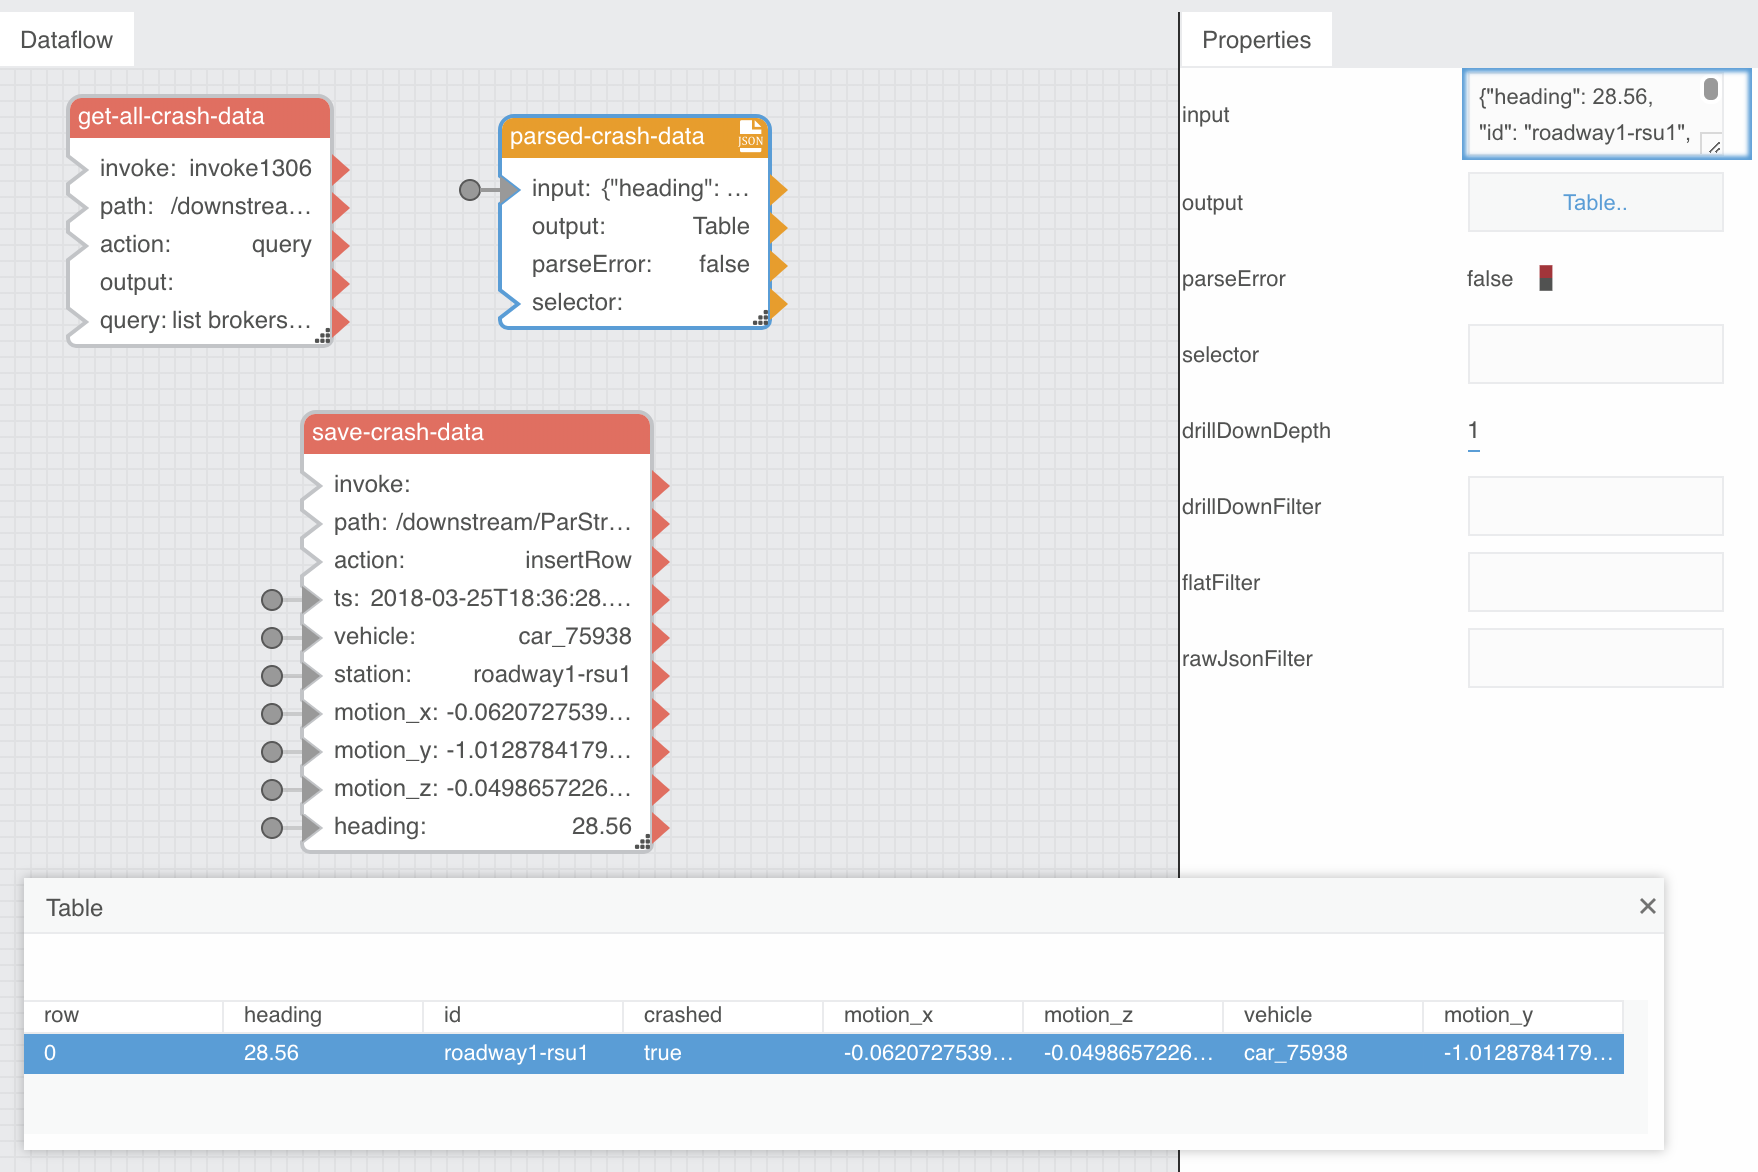
- Close the table
You will fully confirm whether this dataflow is working correctly when you configure the DOT Demo DGLux dashboard below. For now you should see the
save-crash-datafields update when you place the Car Simulator on its side and see a value ofINSERTEDfor theStatusfield in itsPropertiessection.
- Close the
save-all-crash-datadataflow by clicking thexicon next to its name above the editor workspace
Save Sampled RWIS Data to ParStream
- Select
Data > downstream > dataflow - Right-click on
dataflowand selectCreate Dataflow - Name the dataflow
save-sampled-rwis-dataand clickInvoke - Expand
... > dataflow > save-sampled-rwis-data - Open the
save-sampled-rwis-datadataflow in the right-hand editor workspace by clicking on its dataflow icon - Under the
Blockssection, dragTable Operations > JSON Parserto the editor workspaceDataflowsection - Double-click on the new block and rename
jsonParsertoparsed-rwis-data - Navigate to
... > downstream > DQL - Right-click on
DQLand dragQueryto the editor workspaceDataflowsection - Double-click on the new block and rename
querytoget-all-rwis-data - Select
get-all-rwis-dataand edit the following values in the right-handPropertiessection:
- interval:
30 - query:
list brokers | sublist /data/weather/? | subscribe
This DQL query gets any
weatherdata published by any broker the regional broker knows about.
- Click the
Invokebutton associated with theinvokefield - Click the
Tablebutton associated with theoutputfield - Drag the value in row 0 for the
valuecolumn to the parsed-rwis-datainputfield
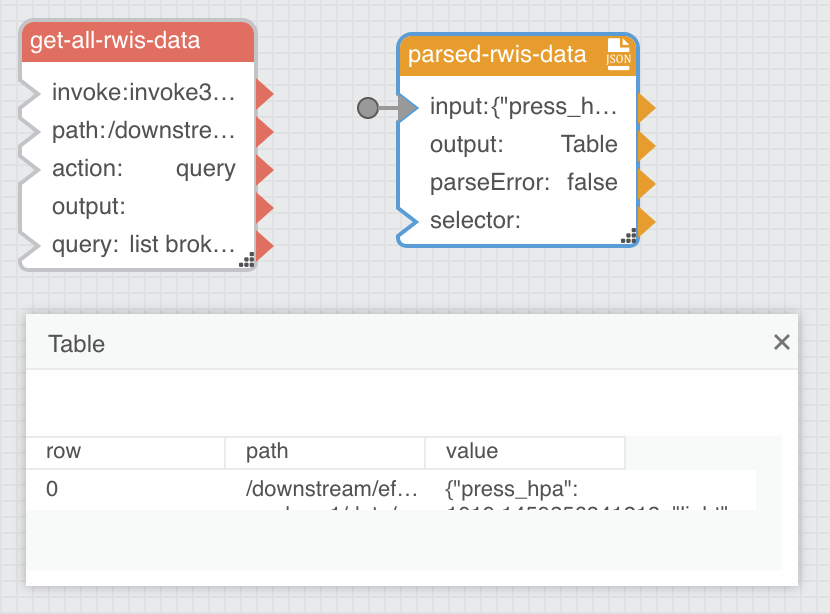
You should see this table data update every 3 seconds.
- Close the table
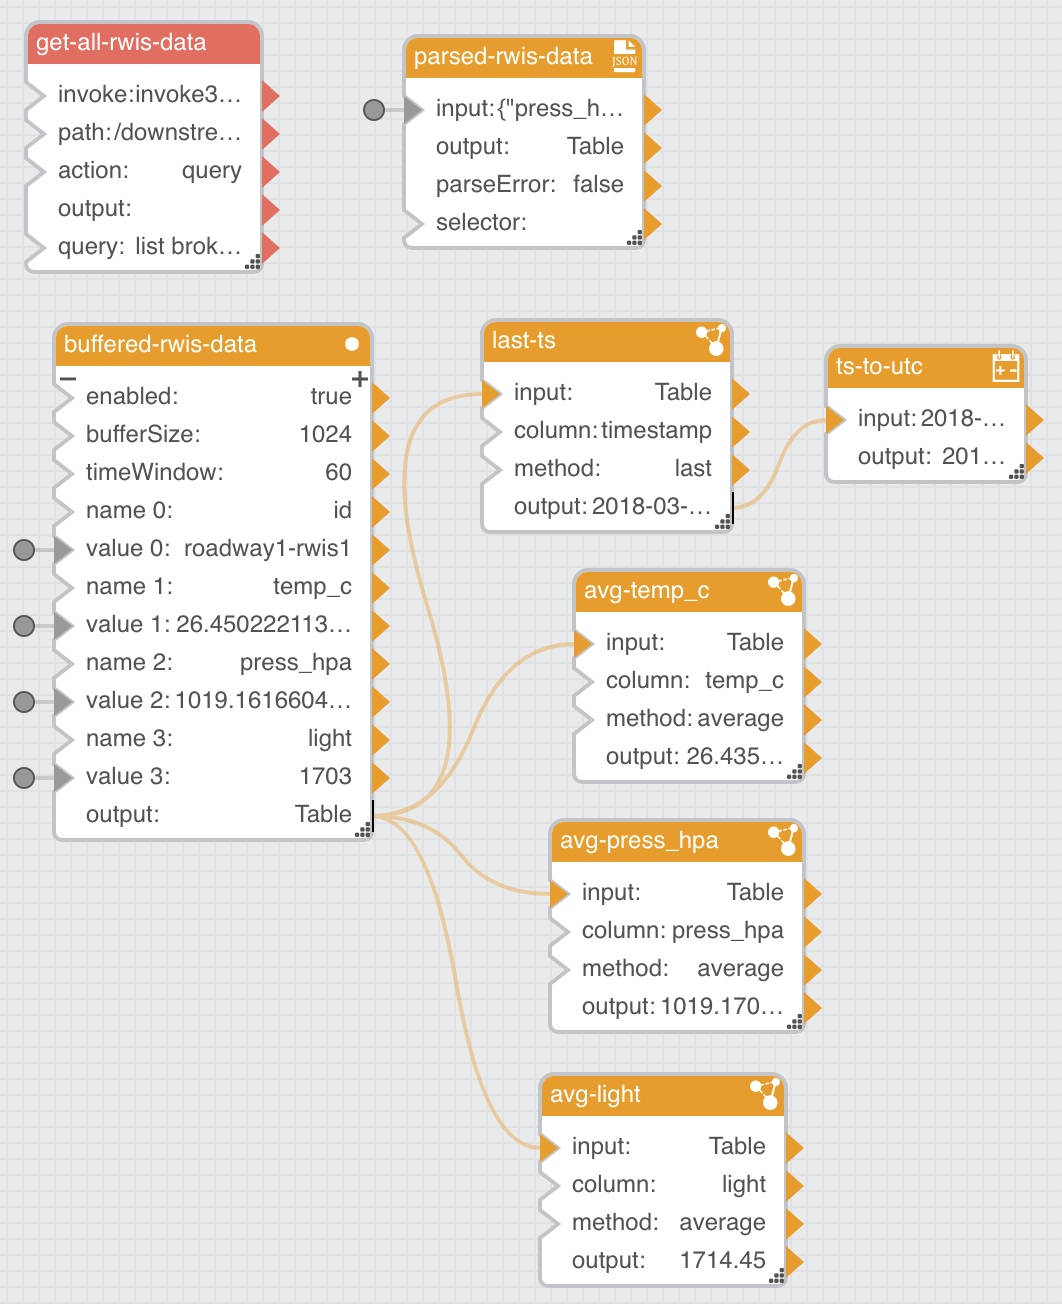
- Under the
Blockssection, dragTable Operations > Realtime Recorderto the editor workspaceDataflowsection - Double-click on the new block and rename
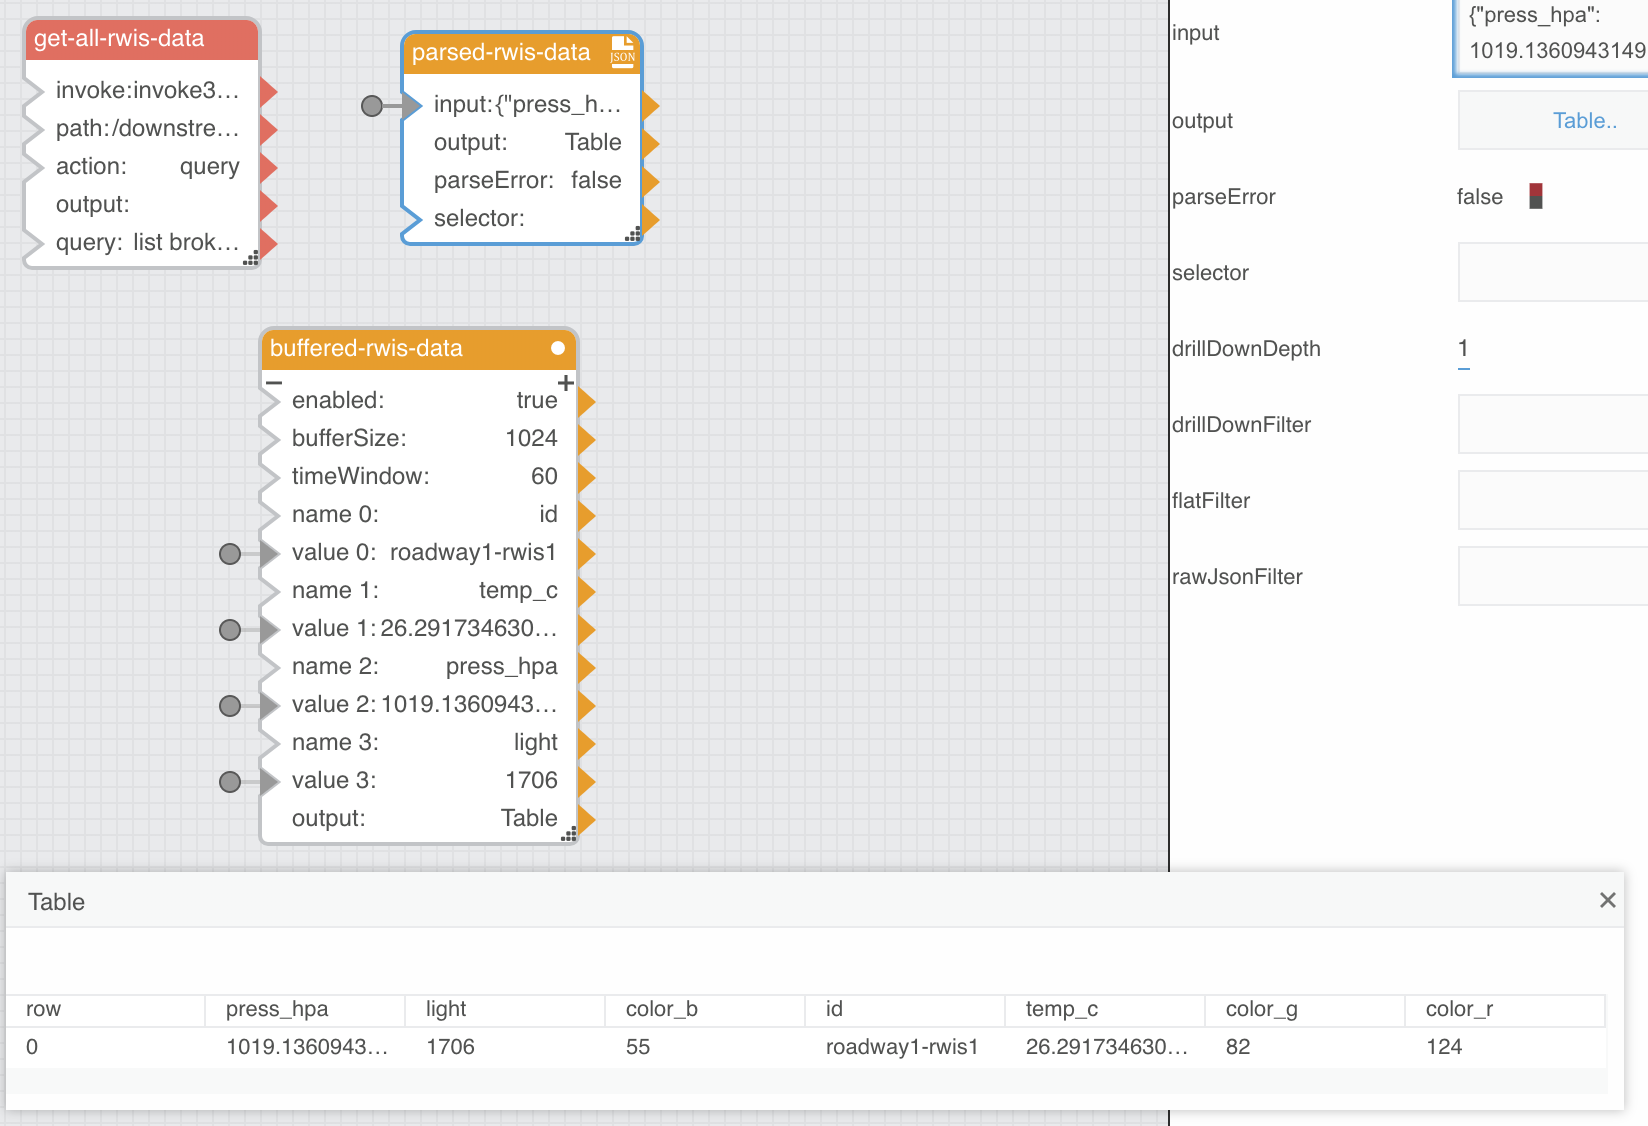
realtimeRecordertobuffered-rwis-data - Click on the small plus icon in the upper-right of the
buffered-rwis-datablock (3) times to add 3 morenameandvaluefields - Mouse over the blue dot associated with the
name 0field in thePropertiessection - Click it and check the
Pinnedbox - Mouse over the blue dot associated with the
value 0field in thePropertiessection - Click it and check the
Pinnedbox - Edit the following values in the right-hand
Propertiessection:
- timeWindow:
60 - name 0:
id - name 1:
temp_c - name 2:
press_hpa - name 3:
light
- Select
parsed-rwis-dataand click theTablebutton associated with theoutputfield in thePropertiessection - Link the table values in row 0 to the associated column field inputs for
buffered-rwis-data
- Drag the
idvalue to the buffered-rwis-datavalue 0field - Drag the
temp_cvalue to the buffered-rwis-datavalue 1field - Drag the
press_hpavalue to the buffered-rwis-datavalue 2field - Drag the
lightvalue to the buffered-rwis-datavalue 3field
- Close the table
If you select the
buffered-rwis-datablock and click theTablebutton associated with theoutputfield in itsPropertiessection you will see that it is generating a table with 60 seconds of rolling RWIS data. This table is the data source for the 60-second moving average that will ultimately end up saved into ParStream. This is an example of how EFM can intelligently sample data to drive insight and efficiency or otherwise enforce a DOT’s desired operational policies.
- Under the
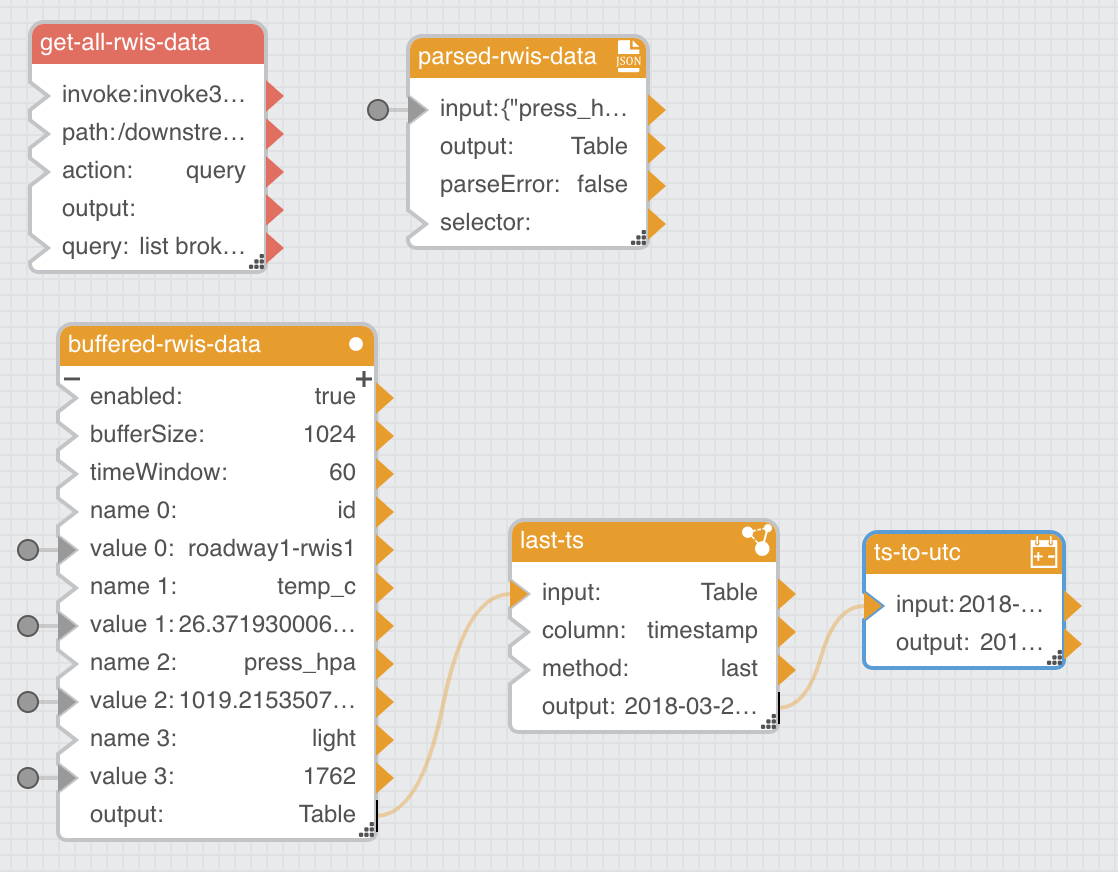
Blockssection, dragTables Operations > Aggregationto the editor workspaceDataflowsection - Double-click the new block and rename
tableAggregationtolast-ts - Select
last-tsand edit the following values in the right-handPropertiessection:
- column:
timestamp - method:
Last
- Link the buffered-rwis-data
outputfield to the last-tsinputfield - Under the
Blocks, dragDate Time Operations > Date Mathto the editor workspaceDataflowsection - Double-click the new block and rename
dateMathtots-to-utc - Select
ts-to-utcand unpin the following fields by right-clicking on the blue dot and unchecking thePinnedbox:
- op
- year
- month
- day
- hour
- minute
- second
- millisecond
This will make the block much smaller and easier to position in the editor workspace by only exposing the needed
inputandoutputfields.
- Link the last-ts
outputfield to the ts-to-utcinputfield
- Under the
Blockssection, dragTable Operations > Aggregationto the editor workspaceDataflowsection - Double-click the new block and rename
tableAggregation1toavg-temp_c - Select
avg-temp_cand edit the following values in the right-handPropertiessection:
- column:
temp_c - method:
Average
- Link the buffered-rwis-data
outputfield to the avg-temp_cinputfield - Under the
Blockssection, dragTable Operations > Aggregationto the editor workspaceDataflowsection - Double-click the new block and rename
tableAggregation2toavg-press_hpa - Select
avg-press_hpaand edit the following values in the right-handPropertiessection:
- column:
press_hpa - method:
Average
- Link the buffered-rwis-data
outputfield to the avg-press_hpainputfield - Under the
Blockssection, dragTable Operations > Aggregationto the editor workspaceDataflowsection - Double-click the new block and rename
tableAggregation3toavg-light - Select
avg-lightand edit the following values in the right-handPropertiessection:
- column:
light - method:
Average
- Link the buffered-rwis-data
outputfield to the avg-lightinputfield
- Navigate to
... > downstream > ParStream-Import > historian > Tables > rwis_data - Right-click on
rwis_dataand dragInsert Rowto the editor workspaceDataflowsection - Double-click on the new block and rename
insertRowtosave-rwis-data - Select
save-rwis-dataand edit the following values in the right-handPropertiessection:
- interval:
60
- Link the ts-to-utc
outputfield to the save-rwis-datatsfield - Link the buffered-rwis-data
value 0field to the save-rwis-datastationfield - Link the avg-temp_c
outputfield to the save-rwis-datatemp_cfield - Link the avg-press_hpa
outputfield the save-rwis-datapress_hpafield - Link the avg-light
outputfield to the save-rwis-datalightfield
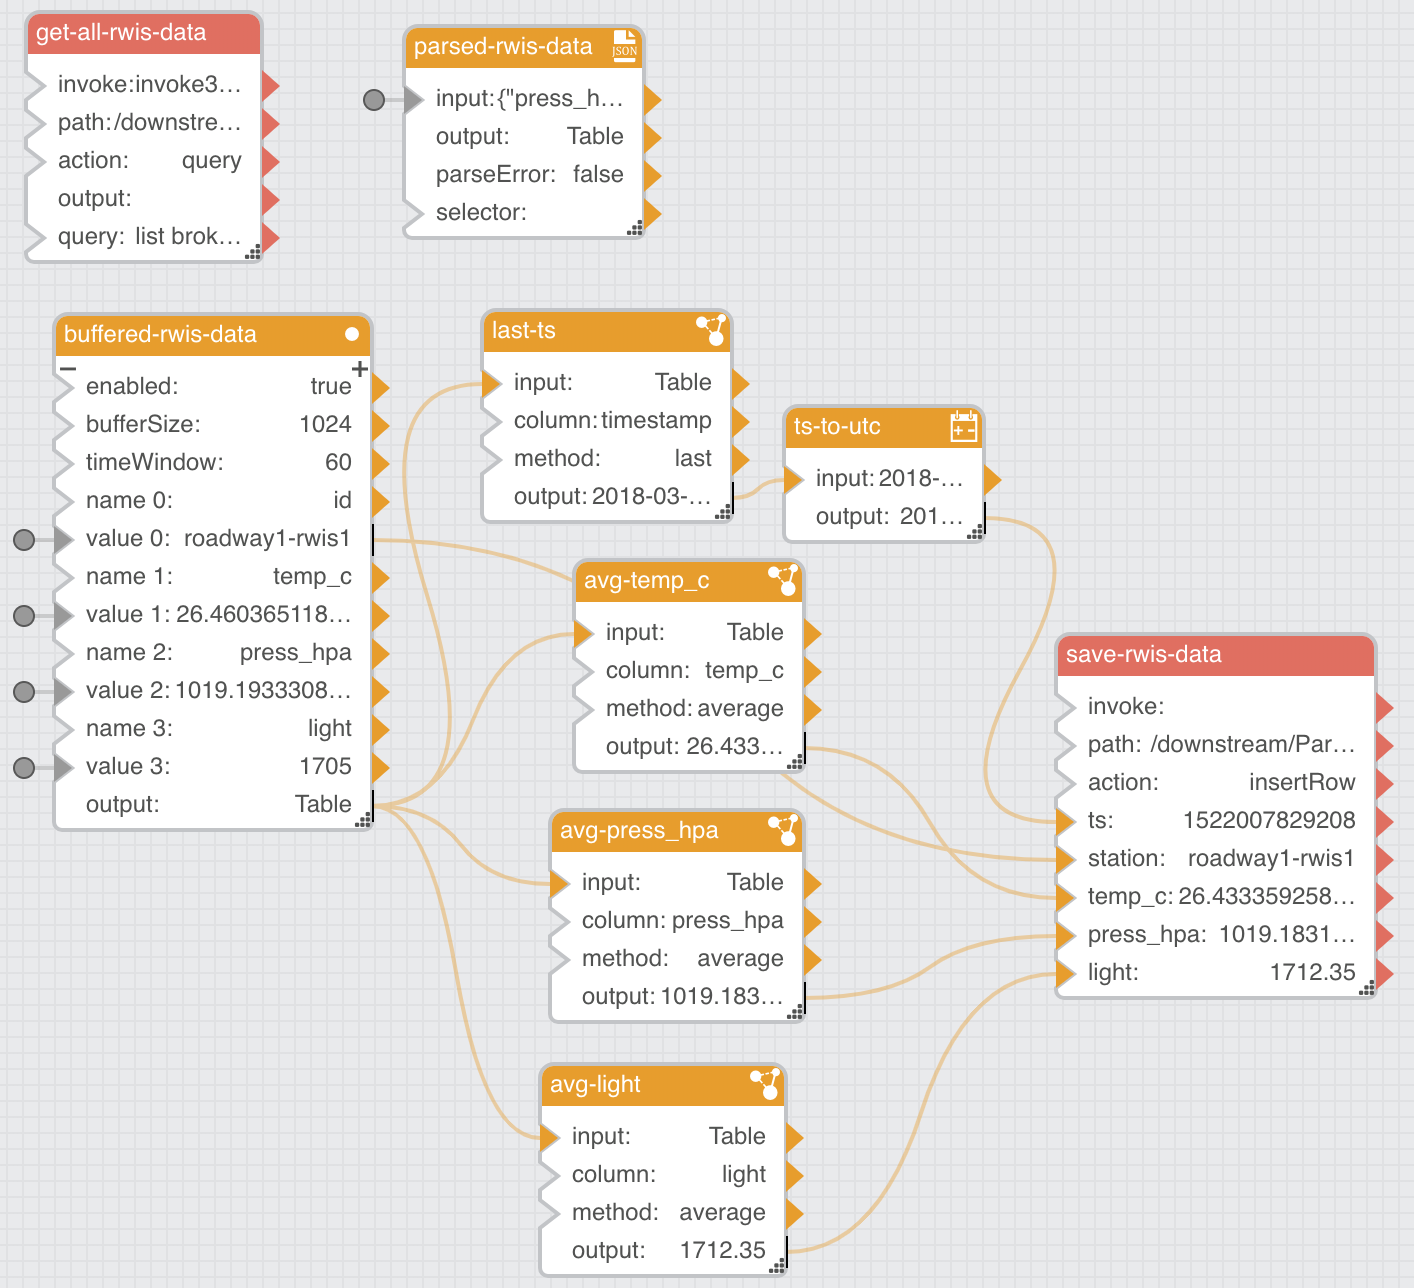
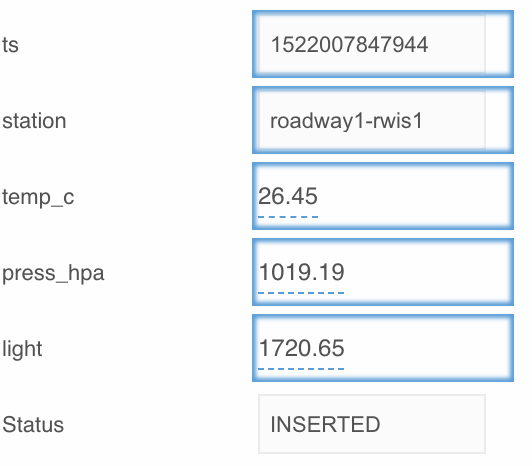
As before, you will fully confirm whether this dataflow is working correctly when you configure the DOT Demo DGLux dashboard below. For now you should see the averaged
save-rwis-datafields update every 3 seconds (the ParStream INSERT itself only happens every 60 seconds per theintervalfield) and see a value ofINSERTEDfor theStatusfield in itsPropertiessection.
- Close the
save-sampled-rwis-datadataflow by clicking thexicon next to its name above the editor workspace - Close the Dataflow Editor
Create a DOT Demo Dashboard in DGLux
- Browse to the built-in DGLux5 dashboard tool installation that comes with EFM here
The first time you connect to the DGLux dashboard tool it will prompt you to install a license. DGLux is separately licensed from EFM. It is used here to show the power of EFM and give an example of how to extract operational data from the system. Most DOTs will use their own Traffic Management System (TMS) rather than something like DGLux.
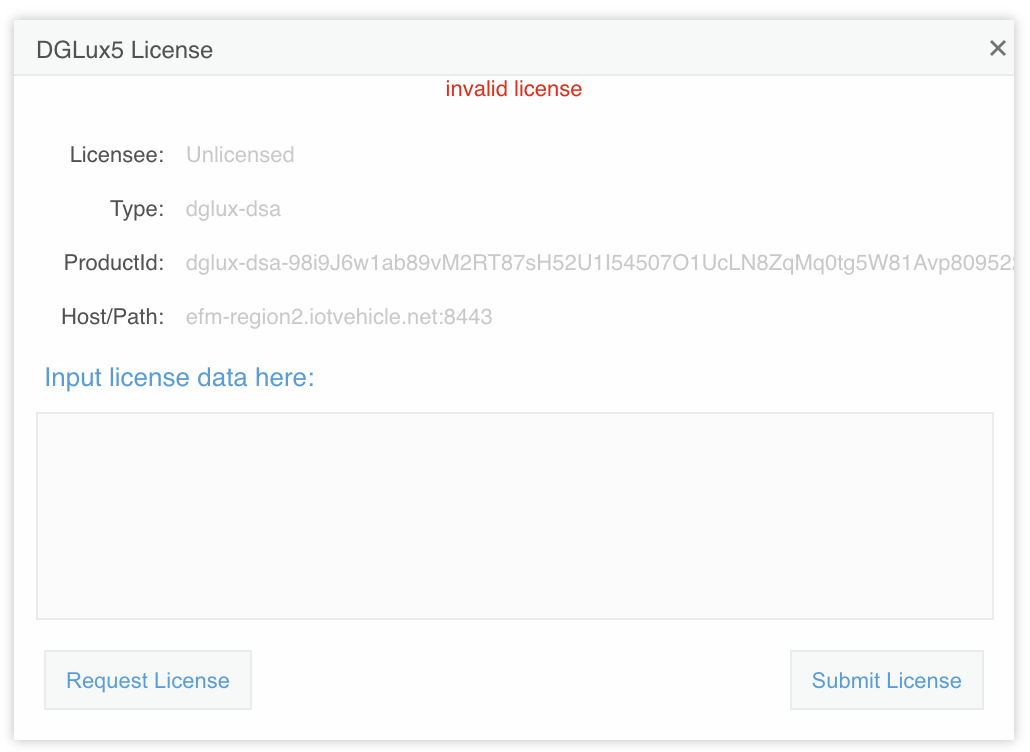
- Click
Request License - Enter your contact information and specify the
180-day Trial License
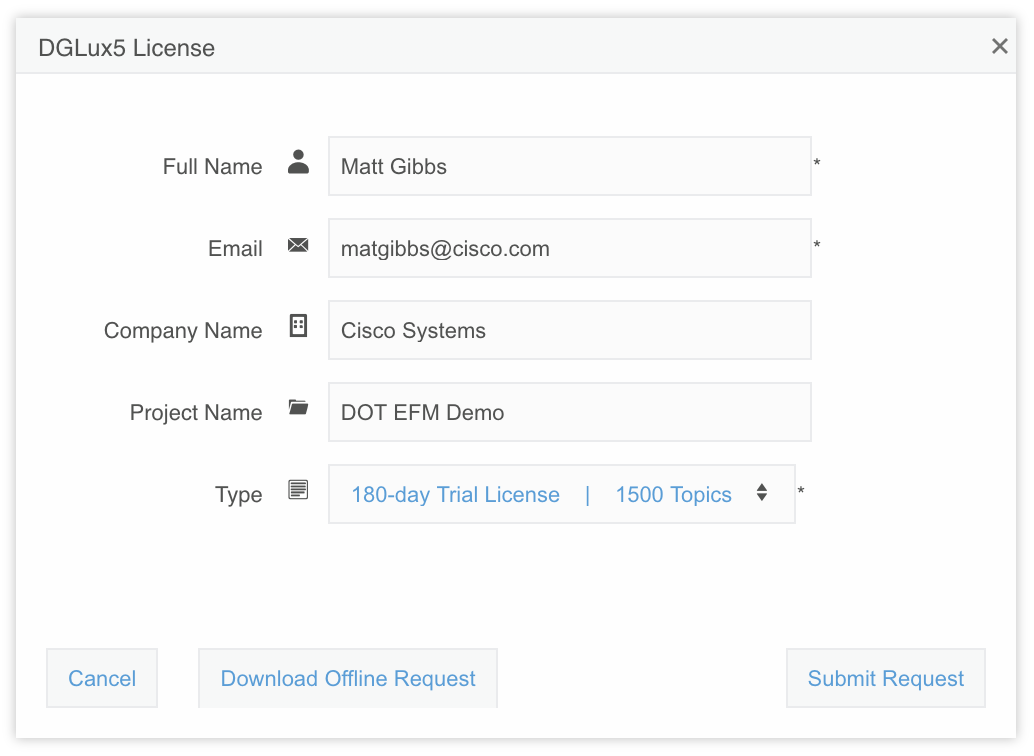
- Click
Submit Request
- Check your email for the automated license delivery with a subject of
Atrius Solution Builder License Generated - Copy the license per the email instructions into the
Input license data here:field in theDGLux5 Licensedialog that should still be open - Click
Submit License - The page will reload and you will be prompted to accept the DGLux5 End User License Agreement
- Click
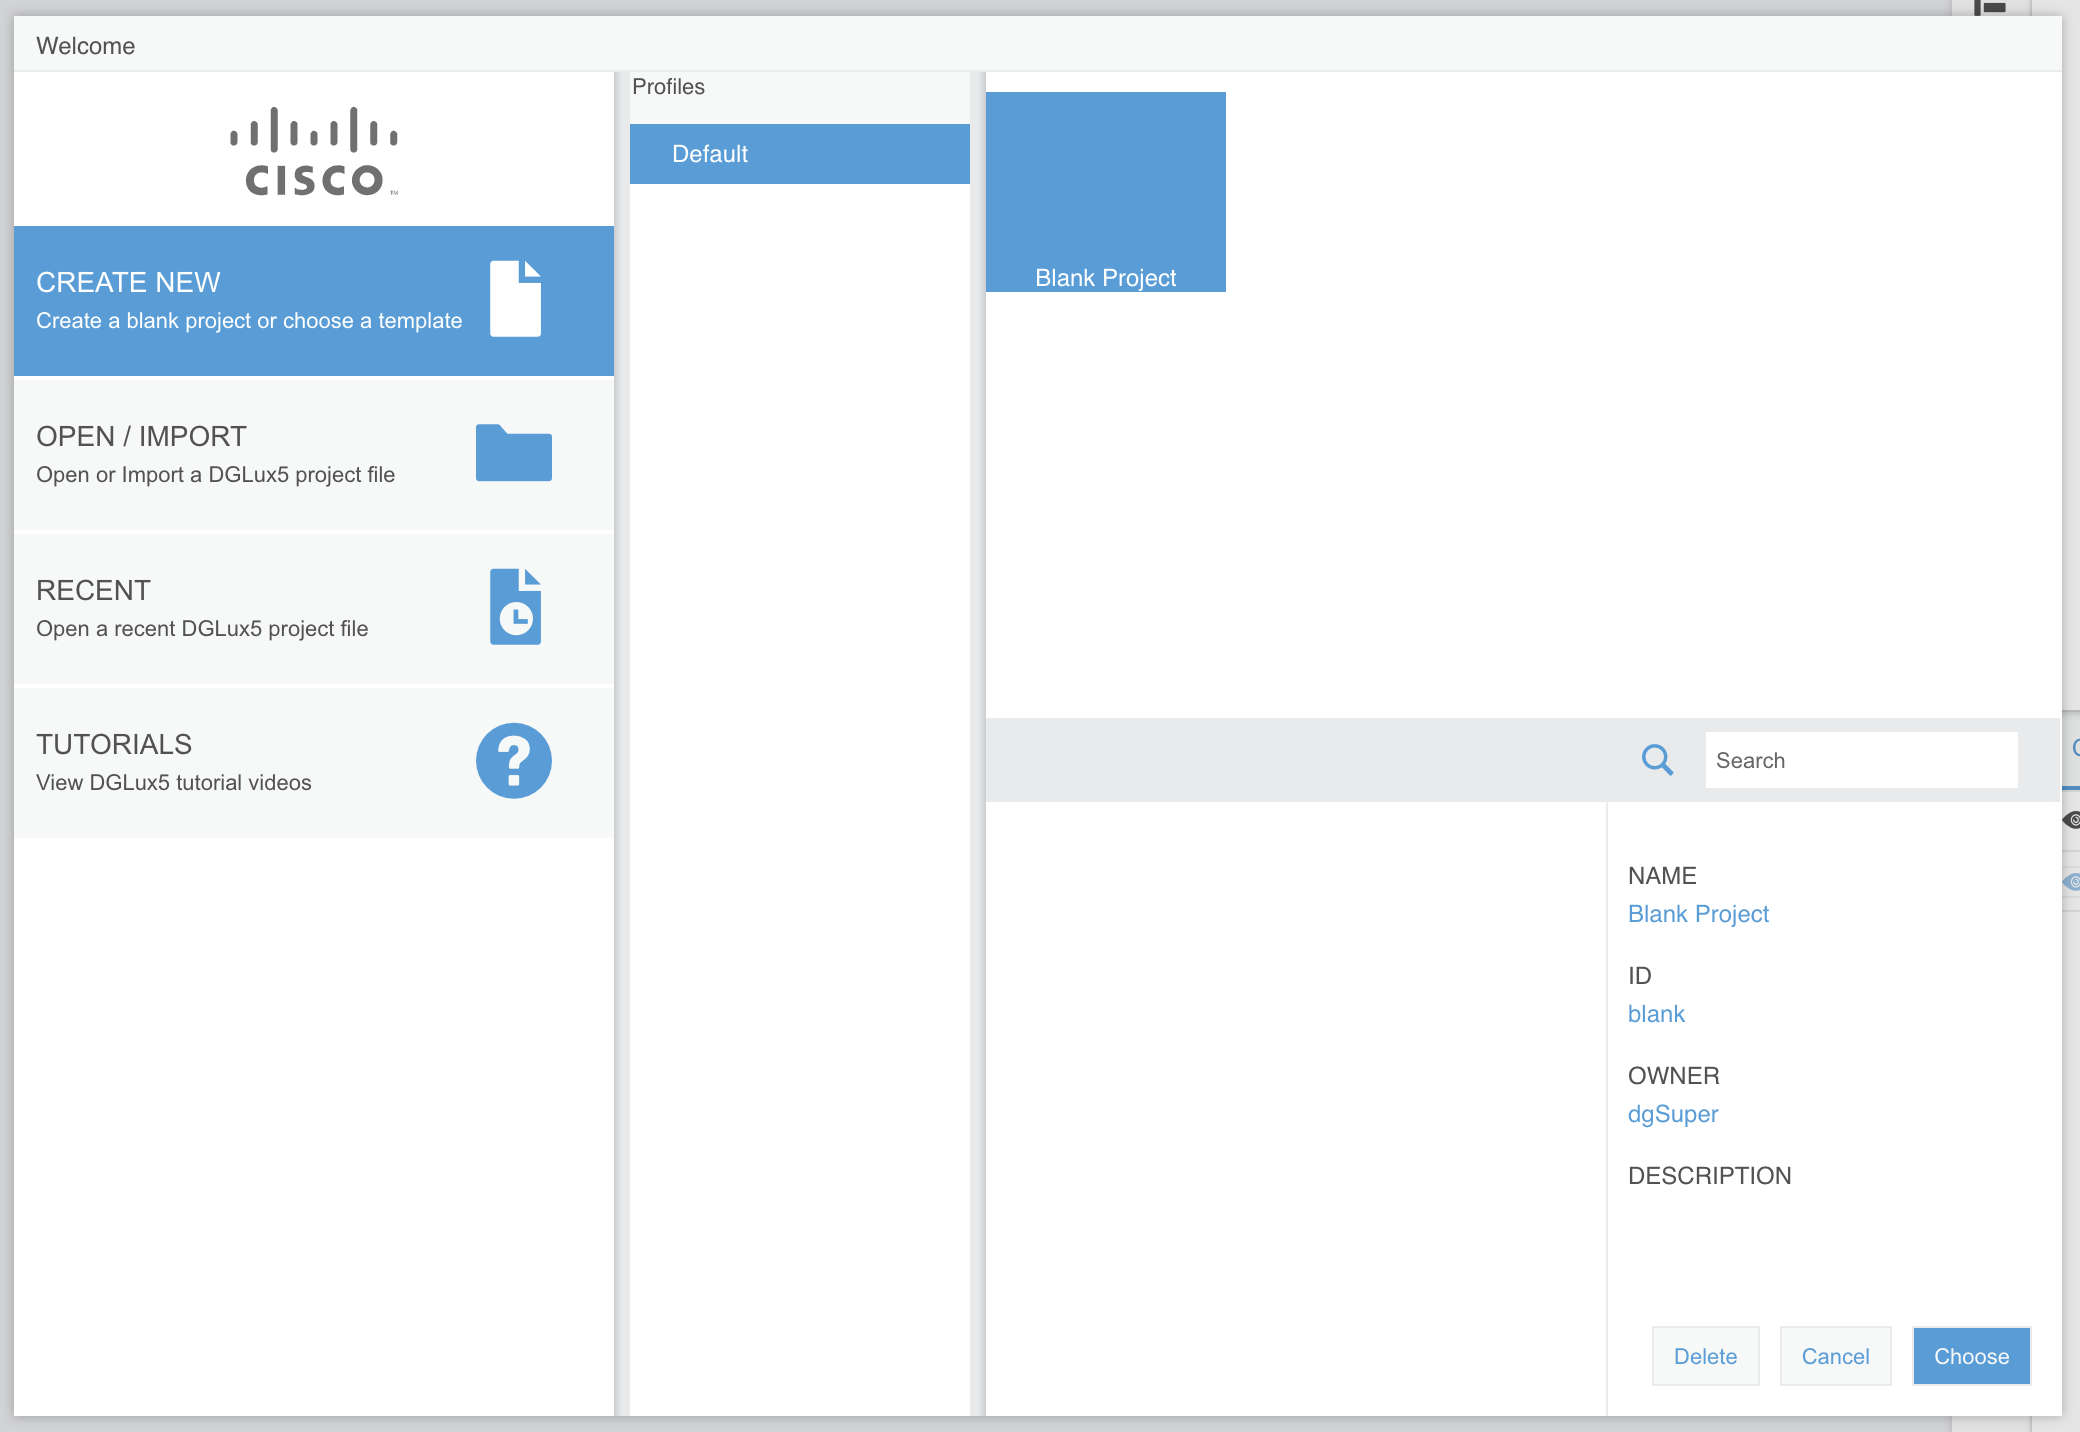
I Agree - Select
CREATE NEW > Default > Blank Project - Click
Choose
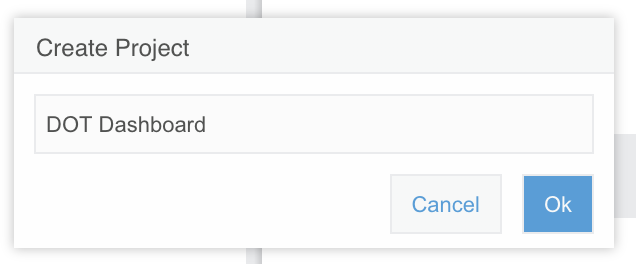
- Enter
DOT Dashboardfor the project name and clickOK
DGLux is a powerful, complicated tool. Rather than send time trying to learn it, you are going to import an existing dashboard to get started as quickly as possible. Feel free to make a copy of the dashboard or create a new DGLux project if you are interested in becoming more familiar with the tool.
- Download the following files for the dashboard:
- The Cisco logo available here
You may have to manually save this to your downloads folder as your web browser will want to display it inline.
- The DGLux DOT Dashboard file available here
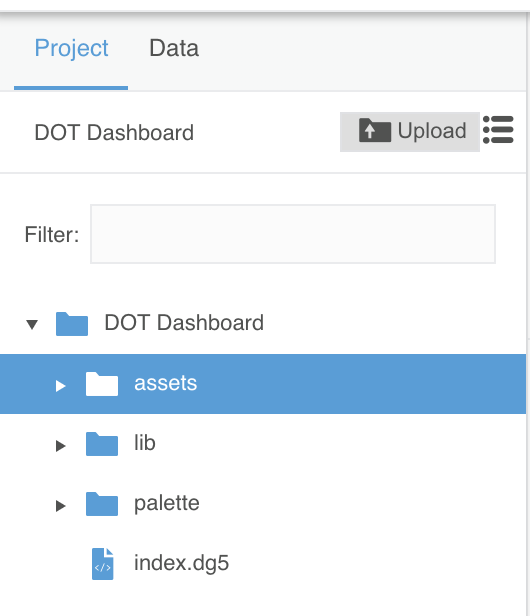
- In the left-hand
Projectsection, select theDOT Dashboard > assetsfolder and click theUploadbutton
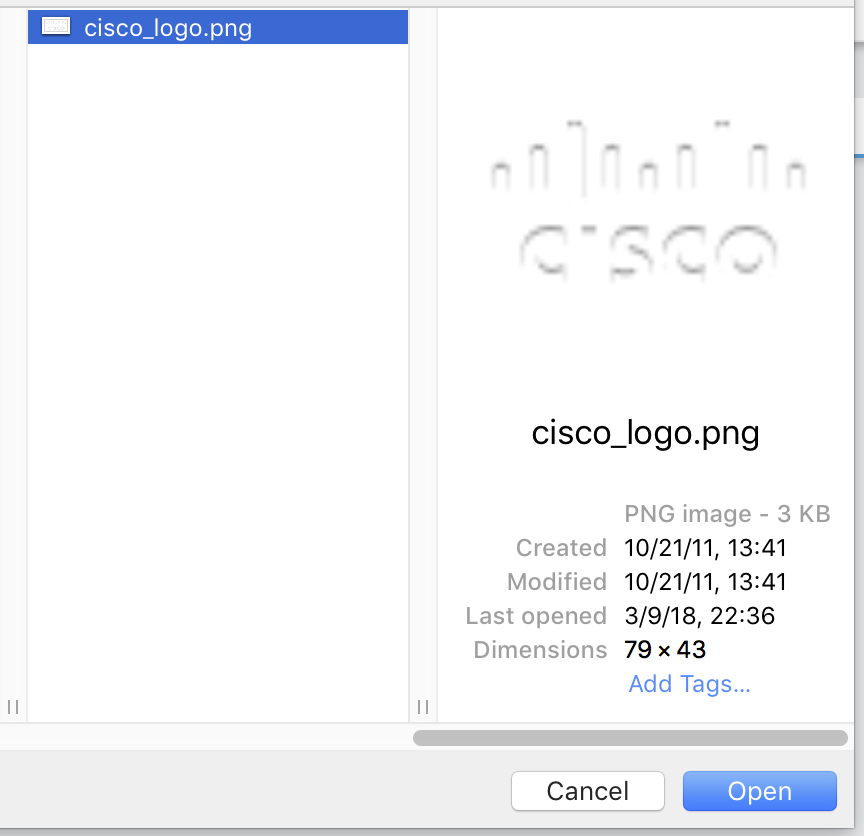
- Browse to the
cisco_logo.pngfile you downloaded and clickOpen
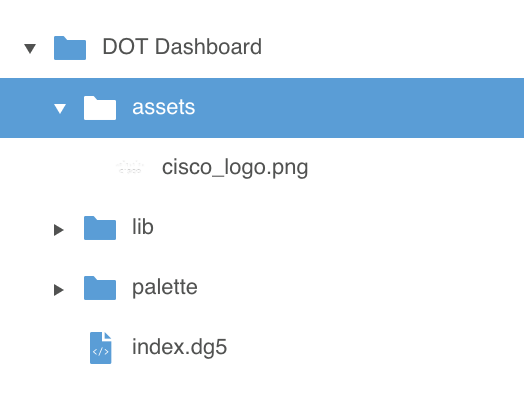
- The logo file should now appear under the
assetsfolder
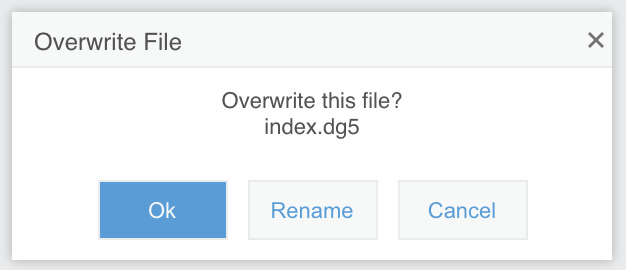
- In the left-hand
Projectsection, select theDOT Dashboardfolder and click theUploadbutton again - Browse to the
index.dg5file you downloaded and clickOpen - Click
Okwhen prompted to overwrite the existingindex.dg5file
- Browse to the DOT Dashboard which should now be available here
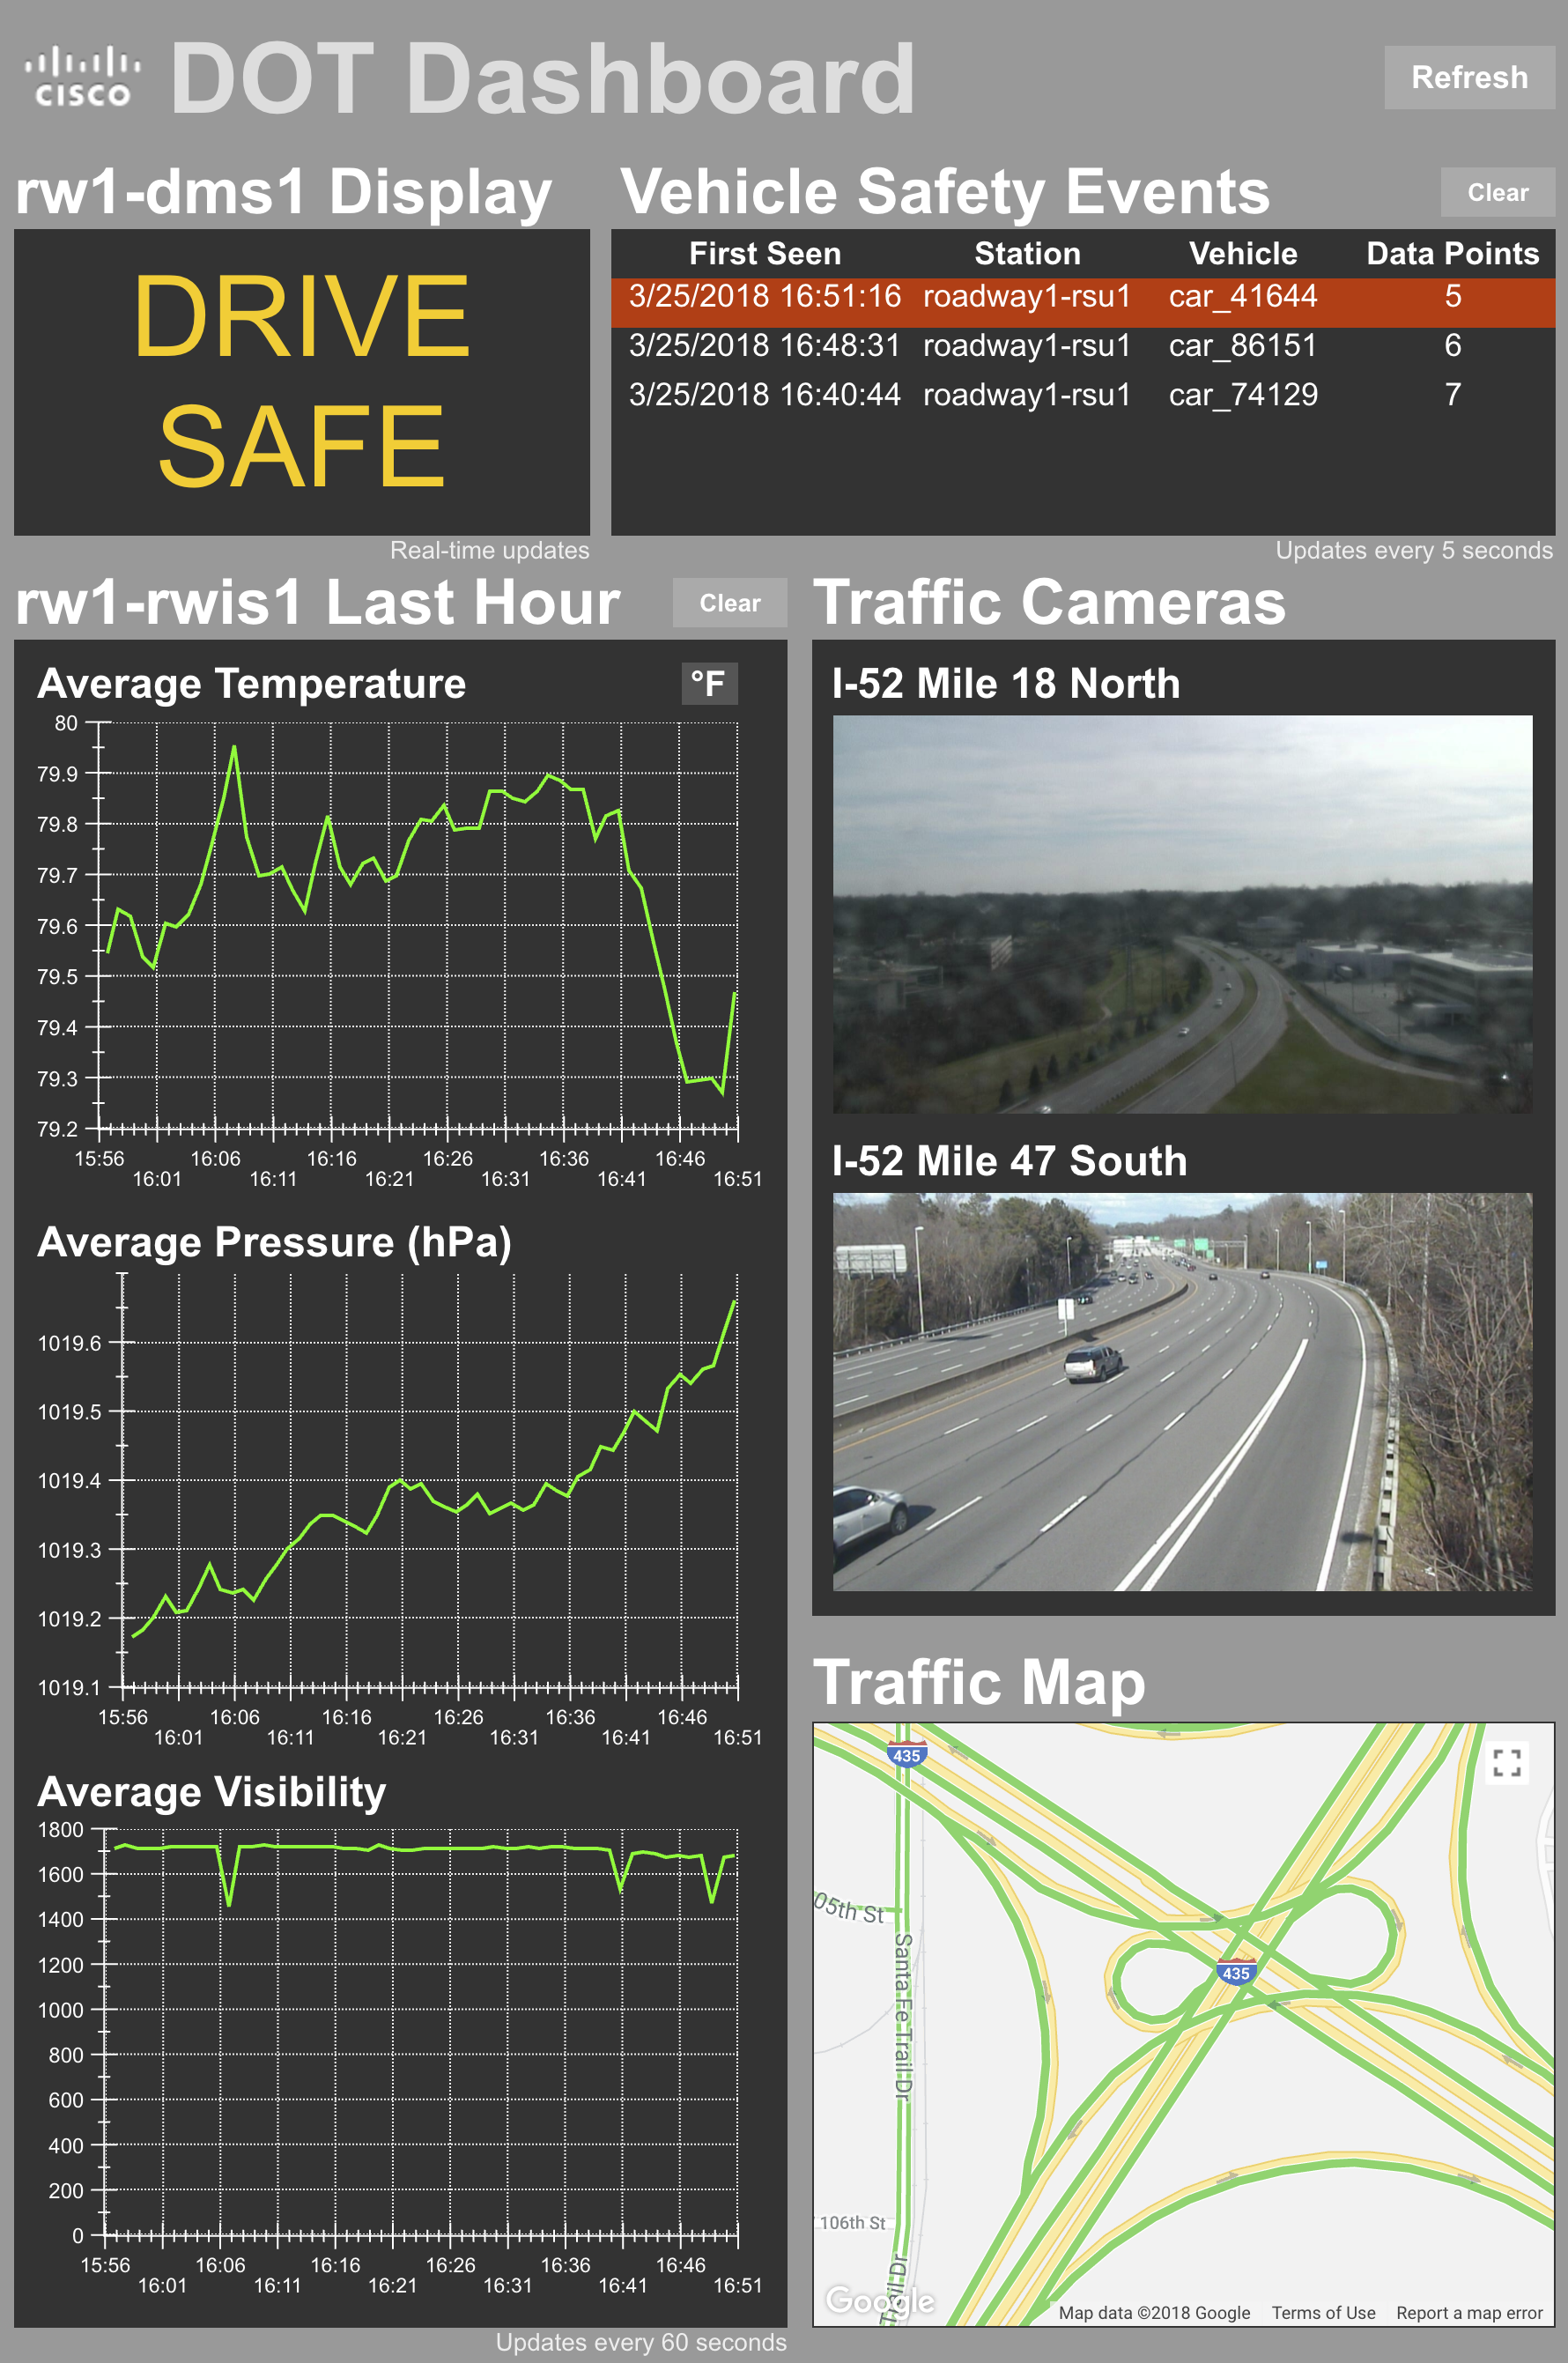
You should see the DMS display update in real time based on your setup. Cover your RWIS sensor and the display should change. The RWIS graphs should update every 60 seconds. Placing the Car Simulator on its side should trigger new entries in the
Vehicle Safety Eventstable. There are also examples of live roadway video data (public feeds from the Internet) and an example Google Maps traffic view. If any of these aren’t updating or don’t look correct, don’t be afraid to reach out for help.
Also be aware that these are publicly-accessible dashboards, so be careful who you share the URL with and be respectful of others’ dashboards. You wouldn’t want someone clearing your ParStream tables in the middle of a demo.
- Close DGLux